- Introducción
- Generar topología de red
- Generar topología de red
- Calcular la red sobre la capa original
- Corregir topológicamente la capa original
- Trabajar con las coordenadas originales
- Usar tolerancia para crear topología de red
- Cargar topología de red
- Gestor de paradas
- Introducción
- Cargar paradas
- Salvar paradas
- Salvar ruta
- Centrar sobre parada
- Fijar velocidades
- Tolerancia
- Ordenar paradas
- Volver al origen
- Obtener el coste de ruta
- Habilitar y deshabilitar paradas
- Alterar el orden de las paradas
- Eliminar una parada de la ruta
- Resumen de utilidades del "Gestor de paradas"
- Cargar capa de nodos
- Cargar/Guardar costes de giro
- Generar una ruta. Camino mínimo
- Borrar
- Conectividad
- Árbol de recubrimiento mínimo
- Matriz Orígenes - Destinos
- Evento más cercano
- Área de Servicio
Introducción
Introducción
GvSIG's network extension calculates routes based on line vector layers loaded into the Table of Contents (ToC).

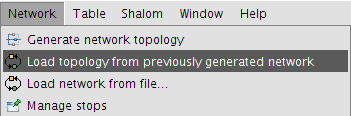
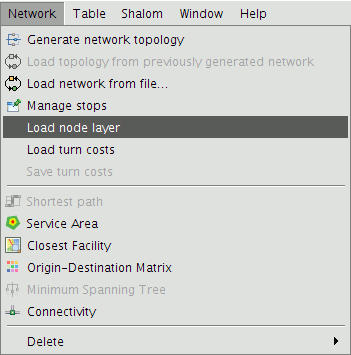
Menu bar with the network extension installed
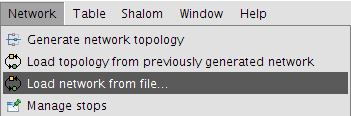
The network functions are activated as follows:
• Load a line layer and make it the active layer.
• This activates a number of options in the Network menu, including the Generate network topology and Load network from file... tools. If a topology has previously been generated for the active layer then the Load topology from previously generated network option is also enabled.
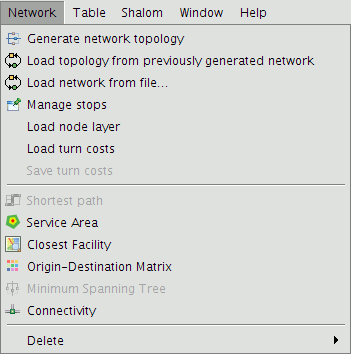
Network menu options
NOTE:
Applying the network tools to layers reprojected on the fly (i.e. the CRS of the layers differ from that of the View) can cause unexpected behaviour. These include problems such as the occurrence of errors when loading turn costs, or the inability to find the nearest event because the stops do not fall within the specified tolerance (even though the display is correct).
It is therefore advisable to avoid using layers that are being reprojected on the fly. Rather reproject these layers using the Reproject geoprocessing tool prior to running any of the network tools.
Generar topología de red
Generar topología de red
This utility creates a topology for the input layer being used. The input layer has to be a line layer and it is necessary to first create a topology before routes can be calculated using the network.
- From the Network menu select Generate network topology.
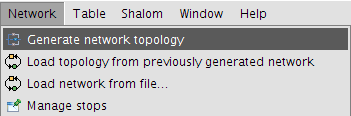
Generate network topology for the line layer
- This displays a wizard that guides the user through the process of building the topology.
Calcular la red sobre la capa original
If this is the first time that the layer is being used for network analysis then this option must be selected in order to generate the layer's topology.
- Select the option Compute the network over the original layer.
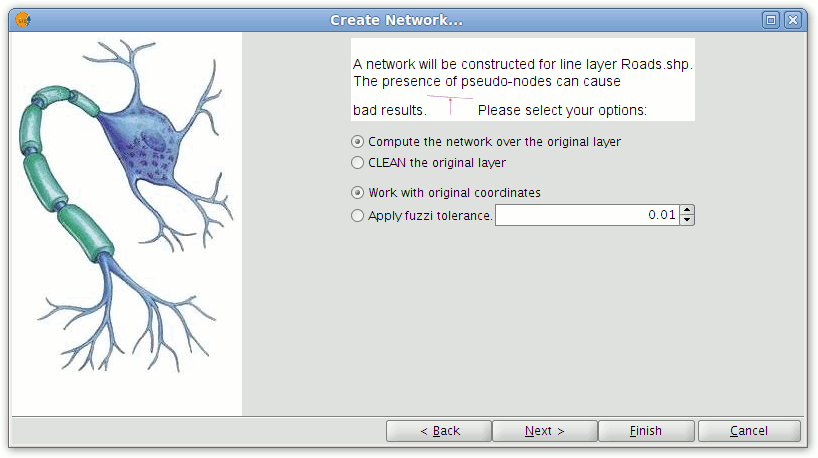
Options for generating the network topology
- Click Next.
In the second window of the wizard attribute fields containing values for the following parameters can be selected (these fields must be defined as numeric):
- Type of route: Indicates what type of route each segment is.
- Length: The length of each segment in metres.
- Cost: Indicates the cost of traversing each segment.
- Conversion factor: Factor to convert the cost field.
- Direction field: The field containing the segment direction.
- Digitised direction: Value indicating the direction of digitising.
- Reverse digitised direction: Value indicating the opposite direction of digitising.
- Save .net file: The directory and file for saving the topology.
NOTE: Any values other than those indicated in the Digitised direction and Reverse digitised direction settings will be taken to indicate flow in both directions along a segment.
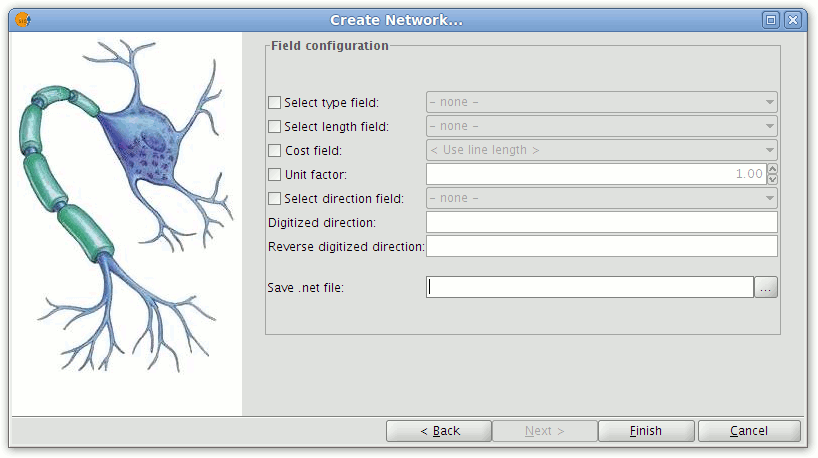
Dialog for configuring fields
Click the check-boxes alongside parameters that will be included in the topology generation. From the drop-down lists select the attribute fields corresponding to each parameter.
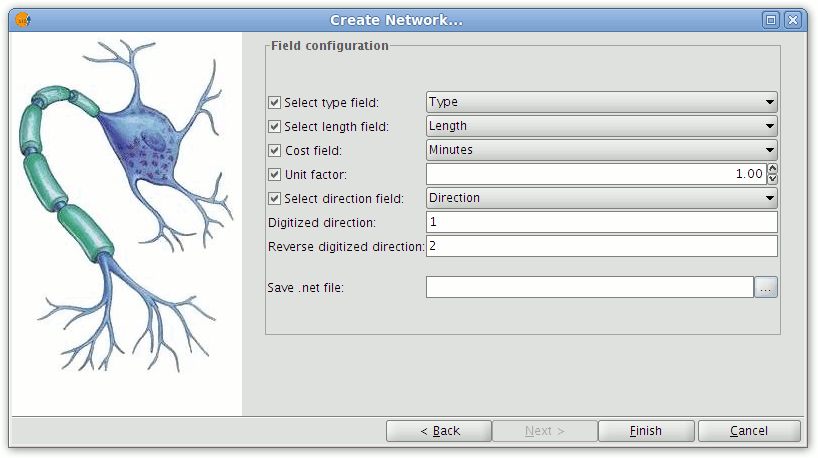
Selecting the fields that help define the network topology
Press the "Finish" button to start the generation of the topography. A window showing the progress of the operation will appear.
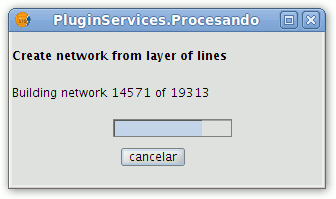
Progress of topology generation
Corregir topológicamente la capa original
This tool performs two functions. Firstly, lines are lengthened according to the specified tolerance and, secondly, nodes are inserted where two lines cross or touch.
- To topologically correct a layer select Network|Generate network topology from the menu bar.
- In the wizard select CLEAN the original layer.

Dialog showing the option for cleaning the original line layer
- Press the Next button and set the fields containing values that will be used to create the topology. Click the Finish button to complete the process.
Trabajar con las coordenadas originales
This option retains the original coordinates of the layer.
Usar tolerancia para crear topología de red
This option allows a tolerance to be defined for generating the topology. For example, if there are two segments with one of them ending at the point (0,0) and the other at (0.01, 0.02), selecting Work with original coordinates will create two nodes. However, if the Apply fuzzy tolerance option is selected and the tolerance is set to 0.02, then only one node will be created.
Cargar topología de red
Cargar topología de red previamente generada
Once a network topology has been generated, the program will automatically ask if it should be loaded and linked to the layer. This option is also available from the Network menu under Load topology from previously generated network. It is not necessary to generate topology each time the layer is used; if the topology has previously been generated then it can be loaded directly.
Menu option for loading a previously generated topology
In the window that appears select the field to use for generating reports and press the OK button.
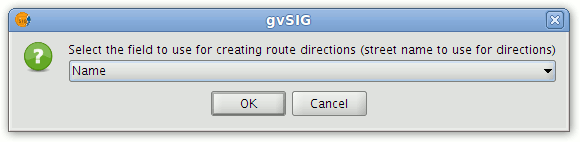
Select the field used to describe routes
If the table contains a field called Name then this field is selected by default. If there is no field called Name in the table then the first field of type string will be pre-selected.
At this point the program is ready to calculate routes.
Cargar red desde fichero
This option is used to load a previously generated network topology from file.
Load the network topology from a file on disk
Select the directory containing the file and click Open.
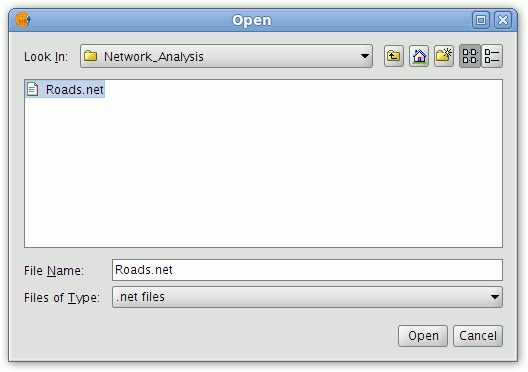
Selecting the directory and name of the .net file
In the next window that appears, select the field to use to describe the generated routes and click OK.
Select the field used to describe routes
If the table already contains a field called Name then this is selected by default, otherwise the first field of type string is used.
At this point the program is ready to calculate routes.
Gestor de paradas
Introducción
To access the stops manager first ensure that a network topology is loaded and then select Network|Manage stops from the menu bar.
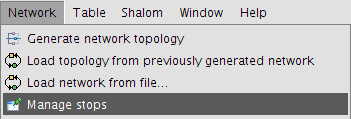
The Manage Stops option on the Network menu
This opens a window where the following options are available:
- Load stops: Load a points layer to use as stops along a route.
- Save stops: Save the route's stops.
- Save route: Save the route that has been generated.
- Centre on flag: Centres the view on the flag representing the selected stop.
- Set speeds: Set speeds for the different types of network segments.
- Cost field: Shows the cost of traversing the route. The cost values depend on the units selected when generating the topology.
- Enable and disable: Determine which stops to use for calculating the route.
- Altering the order of the stops: This modifies the original route.
- Tolerance: The maximum distance from a node or arc for placement of a stop (in map units).
- Order stops: Reorder the stops to produce a route with a lower cost.
- Return to origin: Calculate a route back to the point of origin.
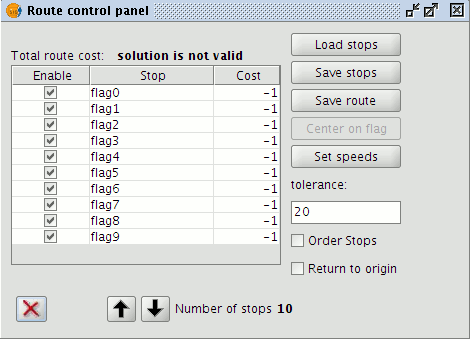
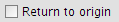
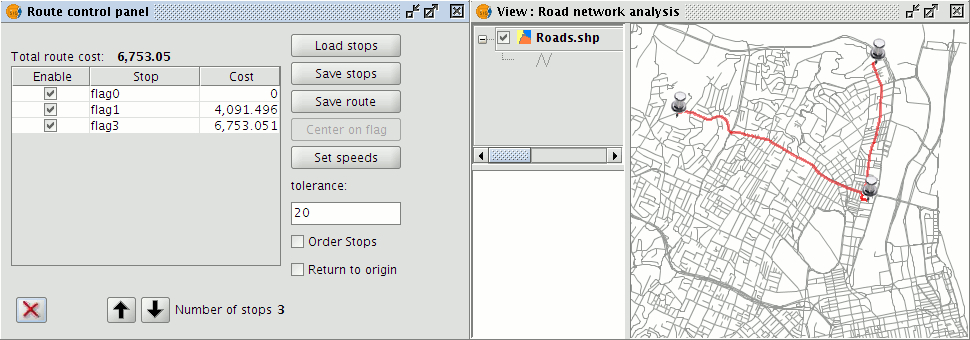
Control Panel showing stops and various control options
Cargar paradas
The network tool allows a shapefile of points to be used as stops when calculating routes.
- Load a shapefile of points into the gvSIG View.
- Select Manage stops from the Network menu.
- Click the Load stops button.
- This brings up a window from which the point layer containing stops can be selected.
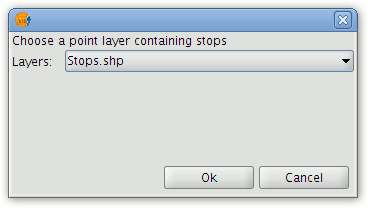
Choosing a layer to import as stops
- In the drop-down list select the point layer to be used. Only point layers loaded into the ToC of the View will be available for selection.
- Click the OK button.
- The points that have been loaded can now be used as stops when calculating routes.
Note
Although the stops can be saved in SHP, DXF or PostGIS format, when loading stops only point layers are accepted (not multigeometry layers).
Salvar paradas
The network tool provides an option for saving the stops along the route in different formats.
- Select Manage stops from the Network menu.
- Click the Save stops button.
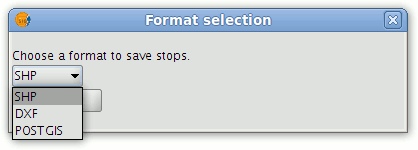
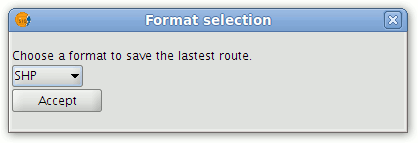
Selecting a format for saving stops
- From the drop-down list choose the file format for saving the stops. The options are: SHP, DXF and PostGIS.
- Click the OK button.
- In the Save window select a location for saving the file to be generated and click the Save button.
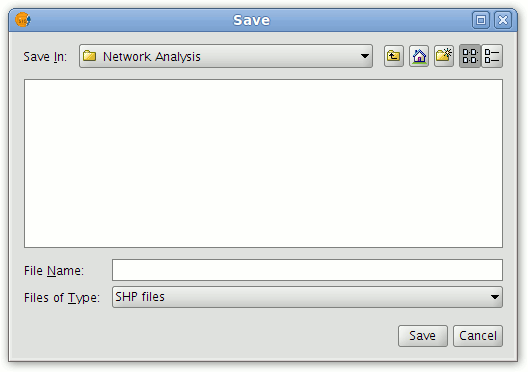
Selecting a directory
- A window appears asking whether to load the new layer into the View. Click the desired option.
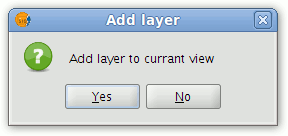
Option for inserting the stops layer into the View
- Once the process is complete, a file of the chosen type containing stops along the route will have been created.
Note: If stops that have been manually created are to be used in future gvSIG sessions they should first be saved using the procedure outlined above.
Salvar ruta
The network tool provides an option for saving previously routes in different file formats.
- Select Manage stops from the Network menu.
- Click the Save route button.
- From the drop-down list choose the file format for saving the calculated route. The options are: SHP, DXF and PostGIS.
Selecting a format for saving the route
- Click the OK button.
- In the Save window select a location for saving the file to be generated and click the Save button.
- A window appears asking whether to load the new layer into the View. Click the desired option.
- Once the process is complete, a file of the chosen type containing the route will have been created.
Note: It should be borne in mind that if calculated routes are to be used in future gvSIG sessions they should first be saved using the procedure outlined above.
Centrar sobre parada
This tool centres the View on the stop selected in the Route control panel. To use this tool simply select the stop on which to centre the View and click the Centre on flag button.
Fijar velocidades
This tool allows the user to define speeds for the roads in km/hour.
The speeds that are configured affect the values displayed in the Cost field of the Route control panel.
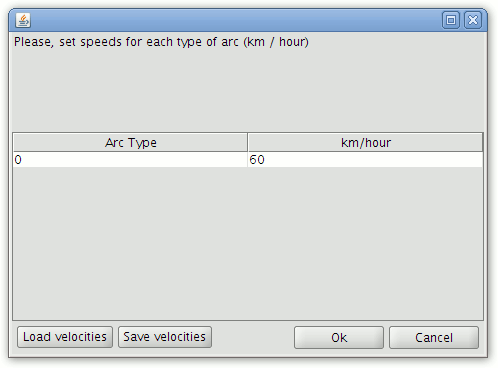
Form for setting the speed for each arc type
To set different speeds for each type of road segment, double click the speed value for the arc type, enter the speed for the arc type and press enter. To exit the window click OK.
Note: If a route has already been calculated, it should be recalculated in order to take the new speeds into account.
Note: The Arc Type values that are displayed come from the type field that was selected when generating the network topology.
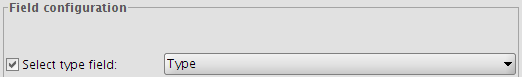
Setting the Type field for generating network topology
Note: It should be borne in mind that if the speeds that have been defined are to be used in future gvSIG network sessions they should be saved by clicking the Save velocities button.
Tolerancia
Allows a tolerance to be set when loading stops from file. This is the maximum distance, in map units, between the stops and the network nodes and arcs.
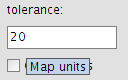
Setting a tolerance value
NOTE: This tolerance value is not used when manually inserting stops on the network. For manual insertions a fixed tolerance of 10 pixels is used.
Ordenar paradas
The Order stops option sorts the stops so as to optimise the total travel time.

Order Stops checkbox
Volver al origen
This option calculates the route back to the point of origin.
Return to origin checkbox
Obtener el coste de ruta
When a route is calculated the aggregate cost is displayed in the Cost column of the Route control panel.
The Route Control Panel showing the Cost field
Note: The cost of the route is updated each time a new route is calculated.
Note: The unit costs are those that were set when generating the network topology. If a cost field was selected, it is usually in seconds. However, if no cost field was specified then the route costs will be determined in the map units (usually metres).
Habilitar y deshabilitar paradas
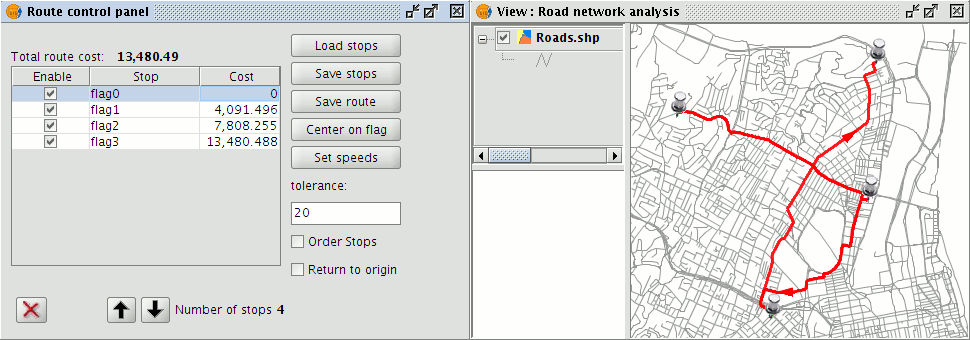
Stops can be enabled and/or disabled by means of the check boxes in the Enable column of the Route control panel.
Alterar el orden de las paradas
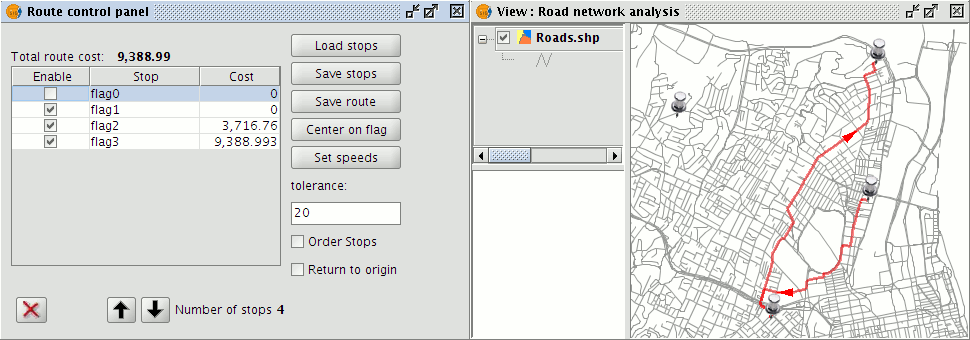
The arrow keys in the Route control panel are used to change the order of stops. Select a stop from the list of stops and then use the arrows to move it up or down in the list.

Buttons for changing the order of stops
Eliminar una parada de la ruta
To delete a stop select it from the list in the Route control panel and click the delete icon.

Remove stops
Resumen de utilidades del "Gestor de paradas"
To summarise, the Manage stops utilities may be used to change the order of stops on a route, enable or disable stops, or to delete individual stops. Once stops have been inserted into the View, these utilities can be accessed by selecting the Manage stops option from the Network menu. The Routes control panel that appears shows the stops in the order that they have been inserted into the View, whether they are enabled or not, and the aggregate cost of reaching each stop.
Managing stops
To enable/disable a stop click the Enable check box alongside the stop. Stops that are disabled are not considered during route calculation but are still displayed in the View.
Enabling/Disabling stops
The order of stops can also be modified in the Routes control panel. Simply select the stop and move it with the arrows to the desired position.
Setting the order of stops
Finally, stops can be deleted if they are no longer required. To do this simply select the stop to be deleted and click the Remove stop button.
Remove stops
The selected stop will be erased from the View.
Erasing stops
Cargar capa de nodos
Cargar capa de nodos
The Load node layer tool generates a point layer containing the nodes of the line layer representing the network. This layer is added to the view. In addition, a default legend is applied to distinguish between the different orders of the nodes.
Load nodes
In the View the different node types are displayed with symbols indicating the number of arcs terminating at each node.
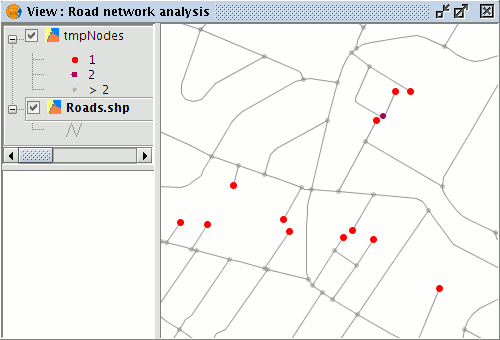
Different types of nodes in the nodes layer
The attribute table of the Nodes layer contains an Order field, which indicates the order of each node, i.e. the number of arcs linking to that node.
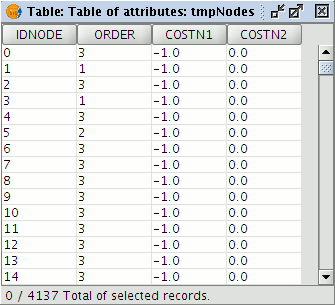
Table of attributes for the nodes
These can be useful for detecting possible digitising errors in the network.
Note: It should be borne in mind that the nodes layer is a temporary layer. If it is to be reused in future gvSIG sessions it should be exported to file to make it permanent.
Cargar/Guardar costes de giro
Cargar costes de giro
Use this option to load a table containing the turns costs.
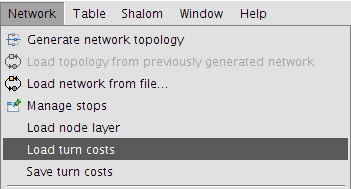
Load the turn costs
In the following window select the table containing the turn costs and indicate which of the table's fields correspond to the Origin Arc, Destination Arc and Turn Cost.
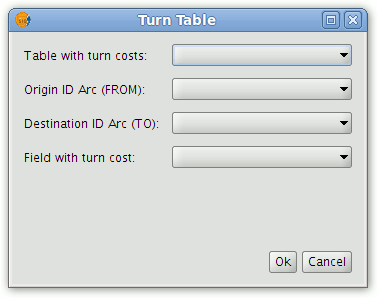
Turn cost options
Guardar costes de giro
The Save turn costs tool saves the turn costs that have been entered by the user in a dbf table. If this information is not saved by the user it will be lost when exiting the application as it is not saved in the project file.
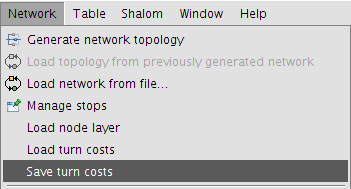
Save the turn costs
Specify the directory in which to save the table.
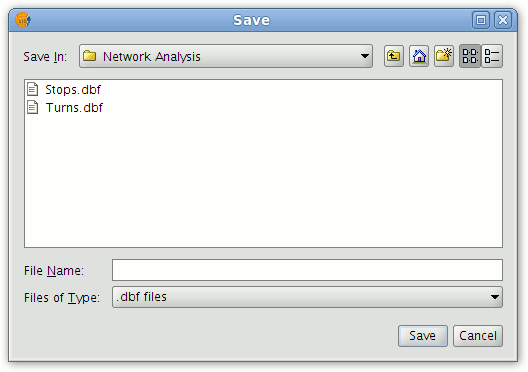
Enter the directory path and file name
The saved table will contain the turn costs that have been manually generated.
Note: It should be borne in mind that if the turns costs are to be used for a network in other gvSIG sessions they must be saved as outlined above. This will allow them to be loaded quickly in future sessions.
Generar una ruta. Camino mínimo
Generar una ruta. Camino mínimo
This utility creates the shortest route between two or more points on the network.
To start using this tool the first thing to do is to load a line shapefile with a network topology.
If the network topology has already been created for this layer then select Network|Load topology from previously generated network from the menu, or else select Network|Generate network topology if the topology has not yet been generated.
Once the topology has been loaded, tools for inserting stops and barriers on the network are enabled on the Network toolbar.
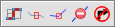
Network extension toolbar
Stops on the route can be inserted in two ways, either onto a segment or onto a node. To insert a stop along a segment or section of the network click the Put flag on a section tool on the toolbar.

Put flag on a section
This tools allows stops to be inserted along any section of the network.
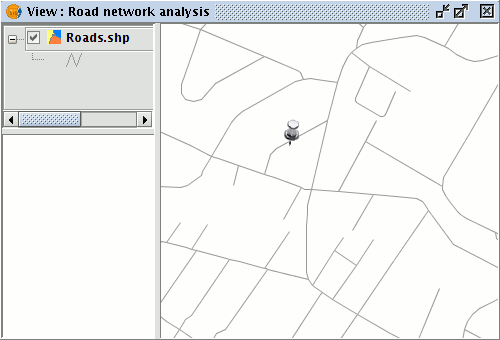
Pushpin symbol representing a stop/flag on a section
To insert a stop at a node click the Put flag on a node tool.

Put flag on a node
This tool will insert a stop at the node closest to the location clicked in the View.
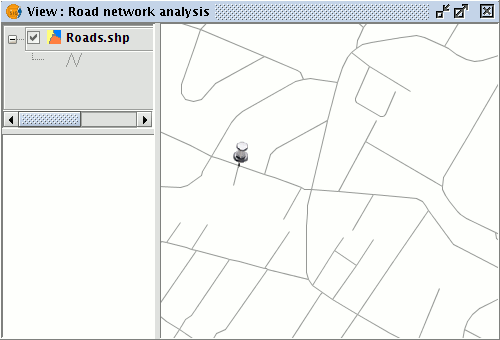
Pushpin symbol representing a stop/flag on a node
Select the appropriate insert tool and in the View click the locations where stops are to be inserted. These stops will form the route. When all the stops have been inserted click the Shortest path button,

Icon for calculating the shortest path
or select Network|Shortest path from the menu.
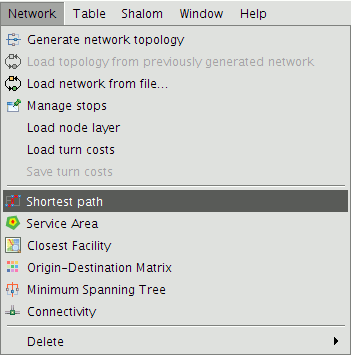
Shortest path option on the Network menu
A shortest route based on the defined topology will be generated.
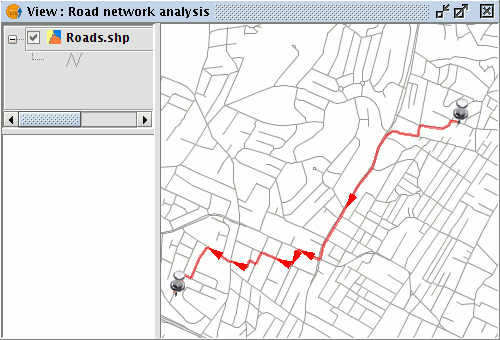
Result of the shortest path calculation with the path shown in red
It is also possible to insert barriers or closures on the network by making use of the Put barrier tool on the Network toolbar.

Put a barrier on the network
Select the tool and place barriers at the desired locations. If the route is recalculated these barriers will be taken into account and the shortest path will be routed around them.
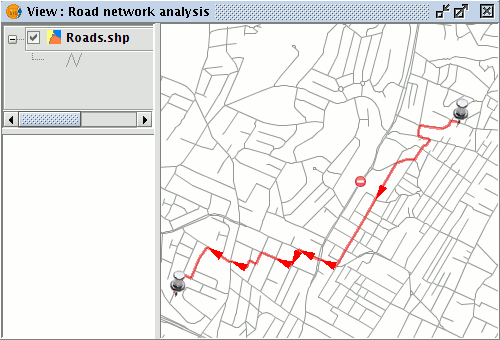
Result of the new route, taking barriers into account
Note: Remember that routes and stops should be saved if they are to be used in future gvSIG sessions. Select Network|Manage stops to open the Route control panel and then click the Save stops and/or Save route buttons to do this.
Informe de ruta
A route report is generated whenever a route is calculated.
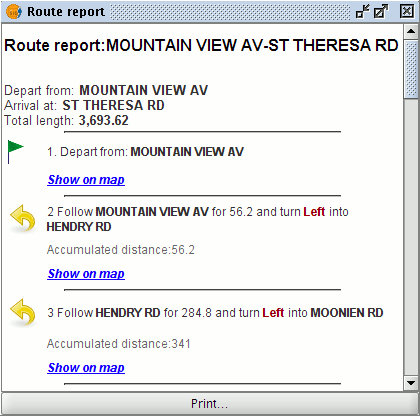
Example of a route report
The report can be printed by clicking the Print button.
If the Show on map link for a particular section of the route is clicked the View will zoom to that segment and the segment will be highlighted.
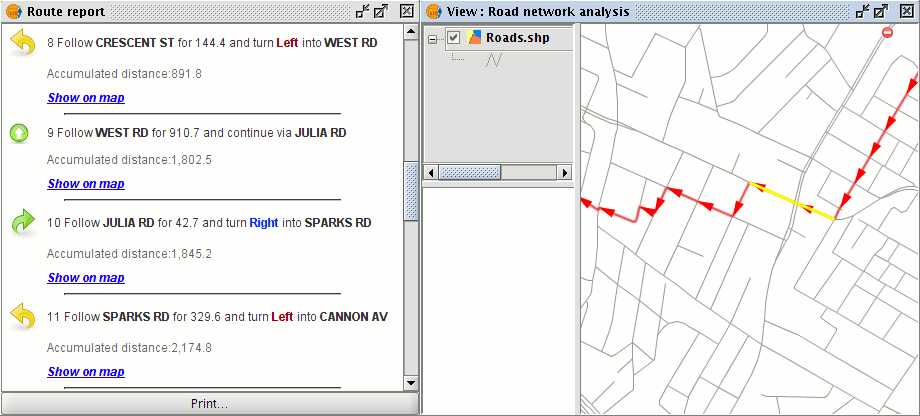
Segment of shortest path shown in the route report and highlighted in the View
Borrar
The network extension also allows all routes, stops and barriers to be deleted.
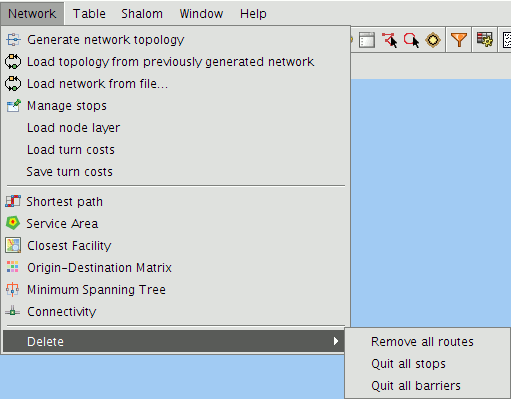
Different options for deleting graphics
To delete all the routes in the View select Network|Delete|Remove all routes. To delete all the stops along the route select Network|Delete|Quit all stops and to delete all barriers select Network|Delete|Quit all barriers.
Conectividad
This tool is used to check the connection status of network nodes from a given point.
To use this utility first load a line layer with a network topology. If the network topology has already been created for the layer then select Network|Load topology from previously generated network from the menu. If no topology exists then select Network|Generate network topology.
To access the connectivity tool select Connectivity from the Network menu.
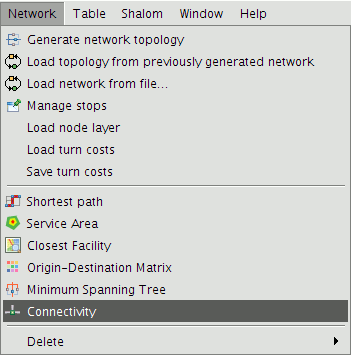
Connectivity tool on the Network menu
This opens the connectivity analysis form.
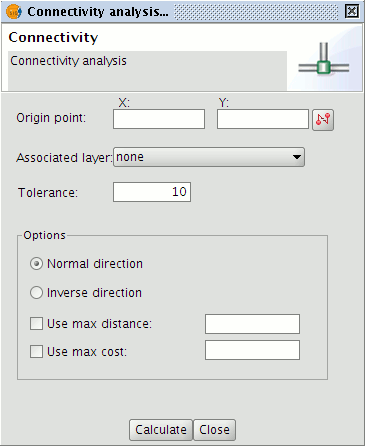
Connectivity analysis form
Use the Set source flag wizard to enter the coordinates of the Origin point on the network. If required, choose an associated layer from the drop-down list. Finally, in the options section choose the network direction, either normal or inverse. It is also possible to specify maximum distance and cost values in order to restrict the extent of the connectivity calculation.
Click Calculate to generate a connectivity analysis and to display the results in the View (Note that at this stage symbols denoting stops will no longer be visible in the View, only the origin point of the connectivity analysis will be displayed).
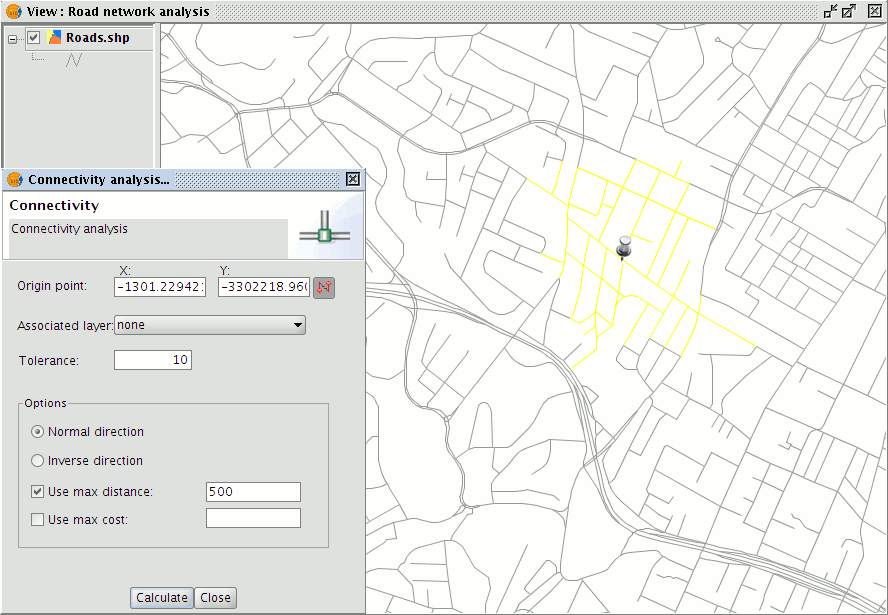
Display of connectivity analysis results
Árbol de recubrimiento mínimo
This tool generates a layer containing the network segments representing a given distance (cost) from some source. The calculation takes into account the flow direction defined by the topology of the network layer.
To use this utility first load a line layer with a network topology. If the network topology has already been created for the line layer then select the Load topology from previously generated network option from the Network menu, otherwise select Network|Generate network topology to create the topology.
Also load a point layer representing origin points into the ToC. Finally, open the Route control panel (Network|Manage stops) and add stops by clicking the Load stops button.
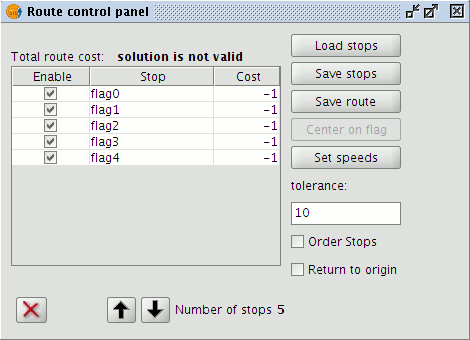
Route control panel for managing stops
To calculate the minimum spanning tree for the active layer in the ToC select Minimum Spanning Tree from the Network menu.
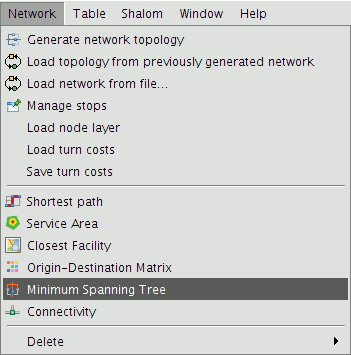
Minimum Spanning Tree option on the Network Menu
In the window that appears enter the cost (i.e. the distance in metres) for determining the coverage of segments from each stop.
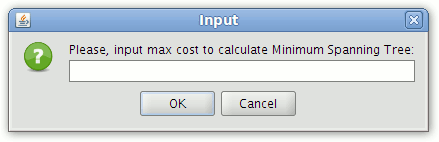
Input form for entering the cost
After pressing the Ok button the resulting tree is automatically added to the ToC as a temporary line layer. The colour and width of the lines can be changed by accessing the Layer Properties.
Open the attribute table of this layer to see the fields that have been generated. The start and end of each segment of the tree has an associated cumulative cost from the stop, i.e. the cost represents the distance travelled, in metres, from the stop in question.
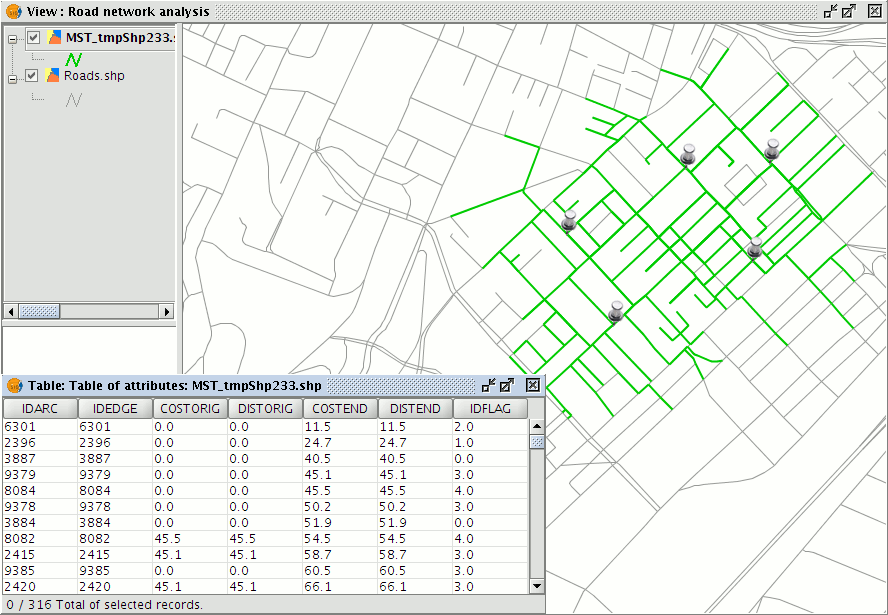
Graphical and tabular results of the Minimum Spanning Tree calculation
The layer can be saved in any of the allowable formats (shp, dxf, postgis, gml) using the Layer|Export to ... command. This exports the entire layer and not just the segments for particular stops. To export segments corresponding to a specific stop first select the appropriate segments by making use of the values in the IDFLAG attribute field.
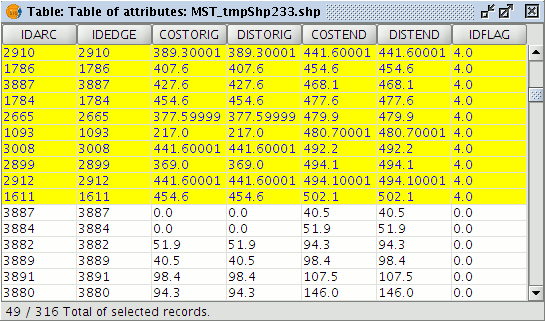
Attribute table of the calculated tree, showing selected records associated with a particular stop
This will export only the section of the tree corresponding to that stop.
Matriz Orígenes - Destinos
This tool calculates distances between sets of source and target points (either on or close to the network).
To use this utility first load a line layer with a network topology. Also add the point layers containing the origins and destinations.
If the network topology has already been created for the line layer then select the Load topology from previously generated network option from the Network menu, otherwise select Network|Generate network topology to create the topology.
To open the tool select Origin-Destination Matrix from the Network menu.
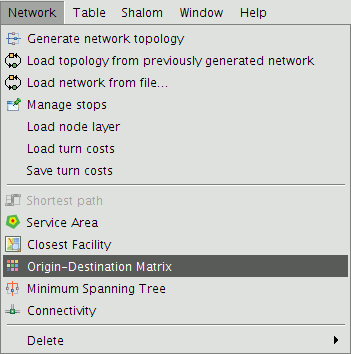
O-D Matrix tool on the Network menu
This opens the following form:
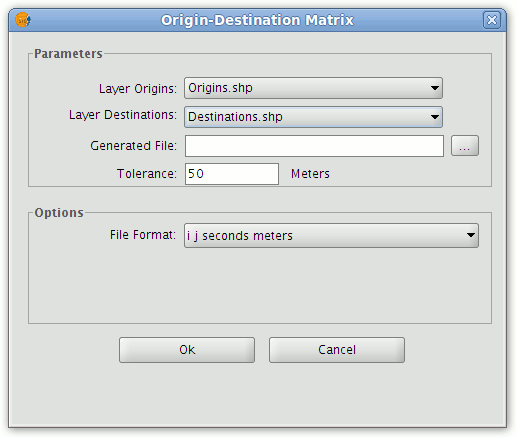
Form for configuring the matrix calculation
In the Parameters section select the point layers in the ToC that represent the origins and destinations. Also specify a path and name for the output text file that will be generated. The tolerance parameter can also be set.
NOTE: The origin and destination points used in the calculation need not be located on the network segments. To allow for this, the tolerance parameter is used to define the maximum distance between the points and the nearest network segment. If the distance between a point and the nearest network segment is greater than the tolerance then this point will be excluded from the calculation.
Click Ok to generate the output file, which shows the results in matrix form.
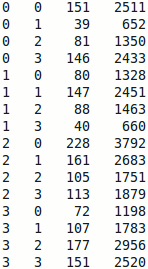
Text file showing the O-D Matrix costs and distances
The matrix columns correspond to:
- Source node index.
- Destination node index.
- Seconds between the O-D nodes.
- Distance between the O-D nodes.
NOTE: If the location of the origins is the same as the destinations, the matrix will be square and the diagonal will be zero. If two points are not connected, the matrix value will be -1. To change the speed used for calculating the time between O-D nodes (in seconds, minutes, etc.) use the Set speeds button in the Route control panel.
To visualise the calculated distances, open the Route control panel, load stops representing the origin and destination points, and manually set one of them as the destination. It is also possible to activate stops in pairs (origin and destination) and then calculate the routes between them. In this way the results of the O-D matrix may be visualised.
Graphical display of the results
Evento más cercano
This tool determines the closest facility to an event, based on specified cost criteria as well as the cost of the routes between each pair of event-facility points. The input point layer represents facilities while stops/flags in the View represent the events. The Closest Facility tool calculates the routes that link the events with the closest facility.
To use this utility first load a line layer with a network topology. If the network topology has already been created for this layer then select the Load topology from previously generated network option from the Network menu, otherwise select Network|Generate network topology to create the topology.
It is advisable that no stops from previously generated routes be present in the View.
Load a point layer representing the facilities (e.g., the facilities might represent the locations of hospitals that could treat patients from a traffic accident).
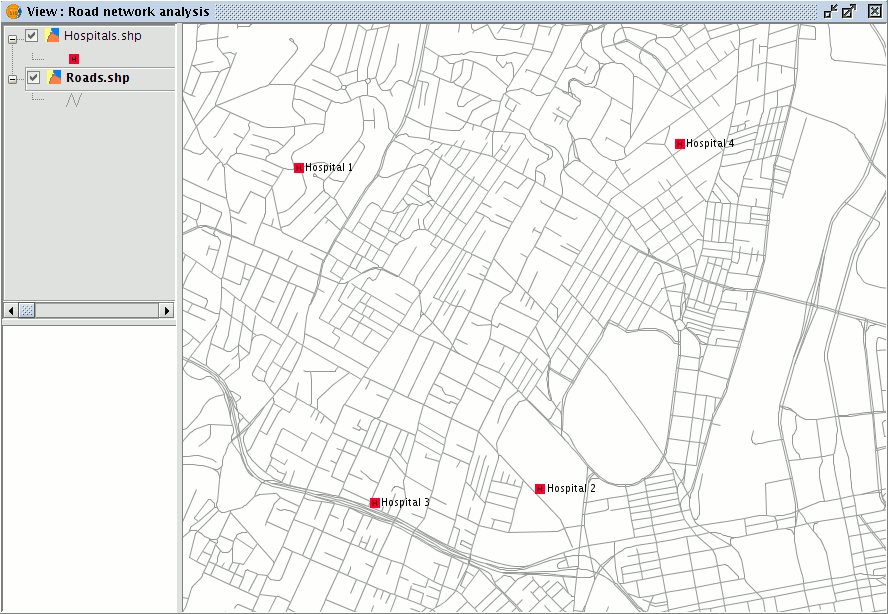
Network layer along with a layer of points (facilities)
If the event coordinates are known the Centre View to point tool can be used to centre the View on the event.
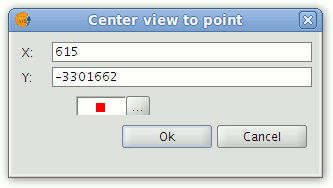
Centre View on the point
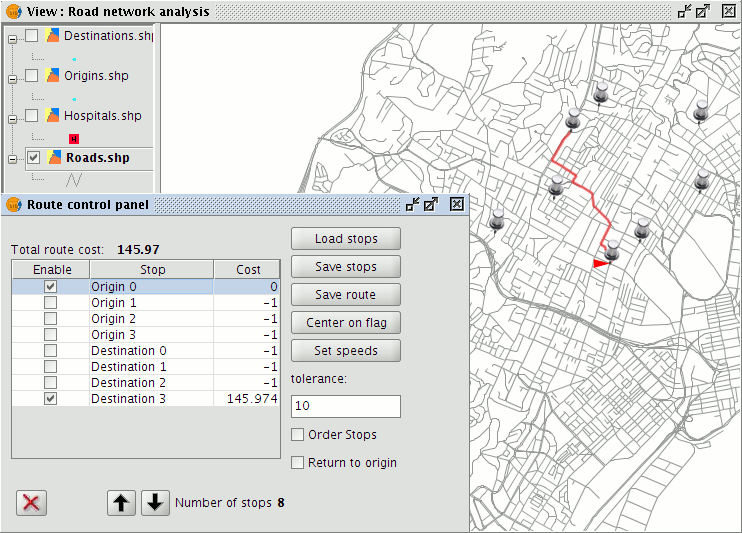
The event can then be defined as a stop in the Route control panel (highlight the line layer in the ToC and then choose Network|Manage stops) or may be placed directly into the View by using the tools on the Network toolbar.
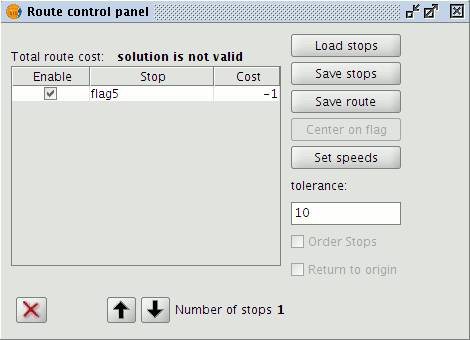
Managing stops (events)
To open the closest facility tool select Closest Facility from the Network menu.
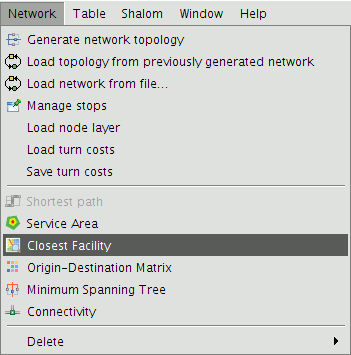
Closest Facility option on the Network menu
This opens a form containing a number of fields that must be filled in.
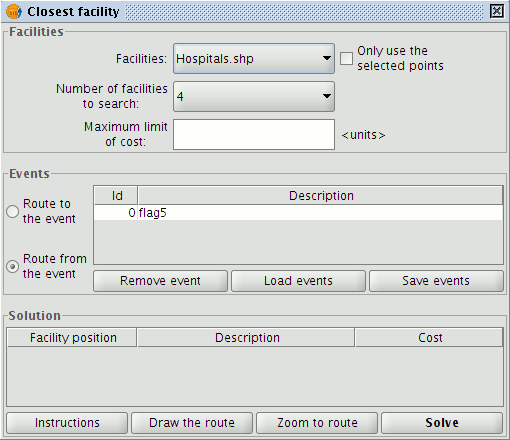
Form for configuring and calculating the closest facility to an event
In the Facilities section choose a facilities layer from the ToC, the number of facilities to search for, and the maximum cost limit to use (distance in metres).
NOTE: It is possible to use only those facilities that have been selected in the layer, or to specify the number to search for if none have been selected.
In the Events section select the event (e.g. of the accident), choose whether the route should be to the event or from the event, and then click the Solve button.
The application displays the possible solutions that meet the requirements. Facilities that do not meet the requirements are discarded. If a solution is selected in the Solution section it is possible to display the route Instructions, Draw the route in the View, and to Zoom to the route.
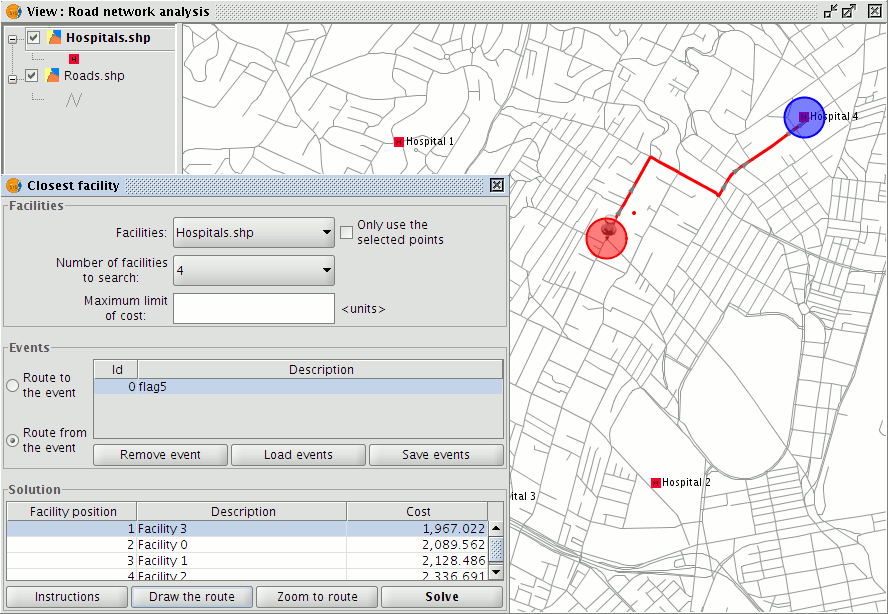
Display of the facility closest to the event and the shortest path between them
Área de Servicio
This tool calculates the service area for each stop according to user-specified costs.
To start using this utility load a line layer with a network topology. If a network topology has already been created for this layer then select the Service Area option from the Network menu. If the topology doesn't exist yet then create one by selecting "Network|Generate network topology.
In the View load a point layer containing stops or insert a series of stops using the tools from the Network toolbar.
To access the Service Area tool, select Network|Service Area from the menu.
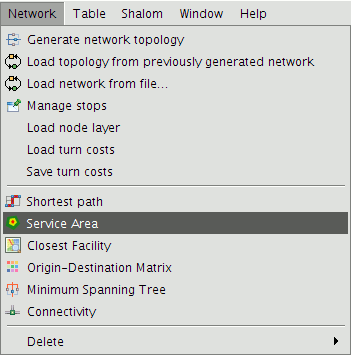
Service Area option on the Network menu
This opens the following form where stops can be also uploaded by clicking the Load stops button.
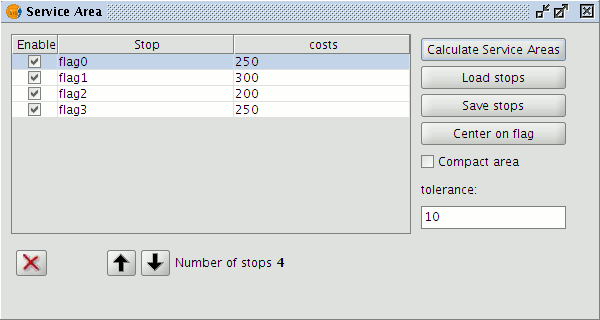
Form for entering stops and costs for the Service Area calculation
Once the stops have been loaded enter a cost for each one in the Costs column.
Click the Calculate Service Areas button to calculate the areas.
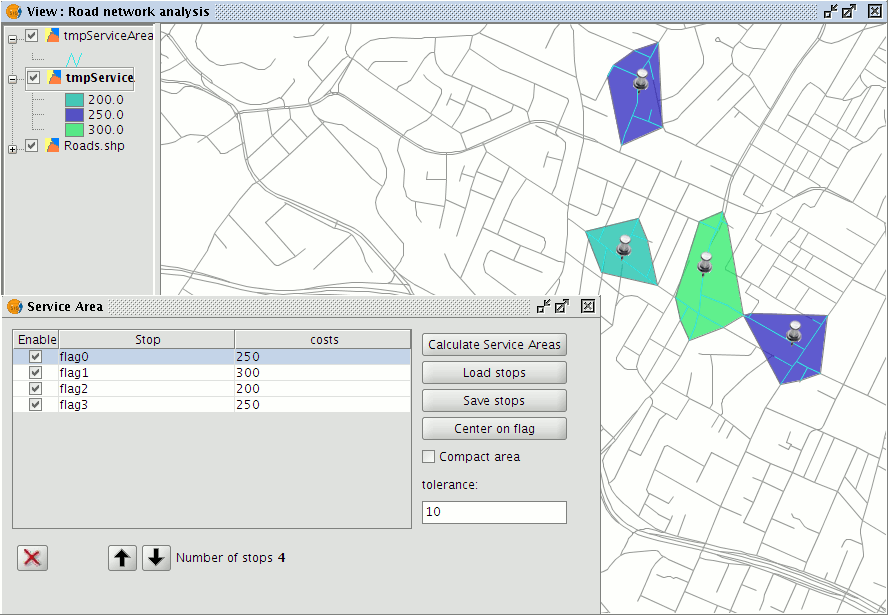
Display of Service Areas for each stop
