Insertar una vista
Insertar una vista
You can insert a view in the map by clicking on the “Insert View” button in the tool bar.

Place the mouse pointer on one of the vertexes of the rectangle which define the view area, left click and drag the pointer to the opposite vertex and drop. A dialogue box appears in which you can define the view-type element properties you have just inserted.
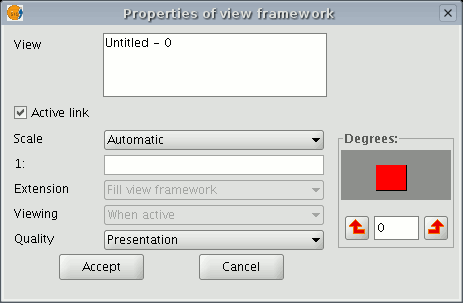
View: You can use the text box to select the view you wish to insert, if there is more than one.
Active link: If this check box is enabled, any changes made in the view (changing colour, adding a layer…) will be shown in the map. Remember that scale changes will not be affected by this check box, because these modifications are regulated by the scale pull-down menu which appears below.
Scale: Select one of the following three scale types: Automatic: If this option is chosen, any scale change made in the view will automatically be shown on the map.
Keep visualisation scale: In this case, although you change the view frame in the map, the layer associated with the view will not resize itself and will keep the same size it has in the view.
User-defined: This option allows you to define a specific scale.
Quality: This defines the visualisation, as either presentation or draft quality.
Degrees: This allows you to specify a degree of rotation when the view is inserted in the map. This option also appears in the rest of the elements that can be inserted: images, scales, legends and texts.
Herramientas de navegación por la vista

There are several tools you can use to navigate around the view.

Zoom in: Enlarges a particular area of the view.

Zoom out: Reduces a particular area of the view.

Full extent: Full zoom of the total area included in all the layers of the view.

Panning: This allows you to change the view zoom by dragging the viewing field all over the view with the mouse. Click and hold down the left button of the mouse then move the mouse in the direction you require.
Configurar cuadrícula de coordenadas
Esta herramienta le permite introducir una cuadricula, en un mapa . Ésta aparecerá sobre la vista que haya escogido, pudiendo seleccionar que sea con elementos puntuales o lineales.
Acceda mediante el Gestor de proyectos al Documento Mapa, tras haber seleccionado una vista, agregue la cuadrícula. Para ello seleccione la vista que desea agregar al mapa y active la casilla de Mostrar Cuadricula.
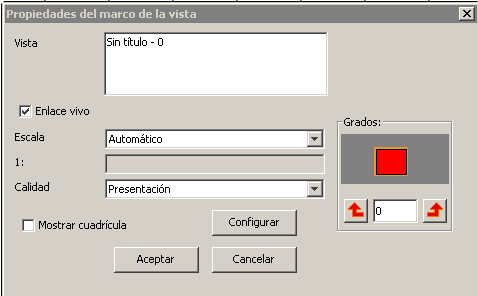
Propiedades de un Mapa. Opción 'Mostrar cuadrícula'
Pulse sobre el botón configurar:
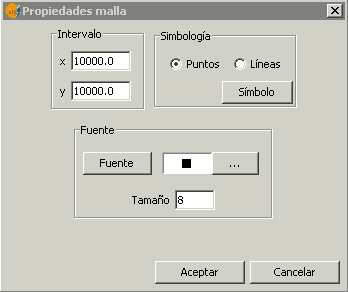
Propiedades de la malla o grid
El intervalo nos permite seleccionar cada cuánto queremos que aparezca la cuadrícula, tanto en el eje coordenado como ordenado. Dependerá fundamentalmente de la escala en la que se encuentre nuestro mapa.
Podemos seleccionar también si deseamos un simbolo lineal o puntual. Dentro de Símbolo podemos seleccionar uno dentro de la libreria, así como darle un grosor o color en concreto.
En el ejemplo se han empleado los intervalos X: 10.000 e Y: 10.000, que quedan muy juntos unos entre otros. Para solucionarlo, haciendo click con el botón derecho sobre la ventana se abre de nuevo la configuracion.
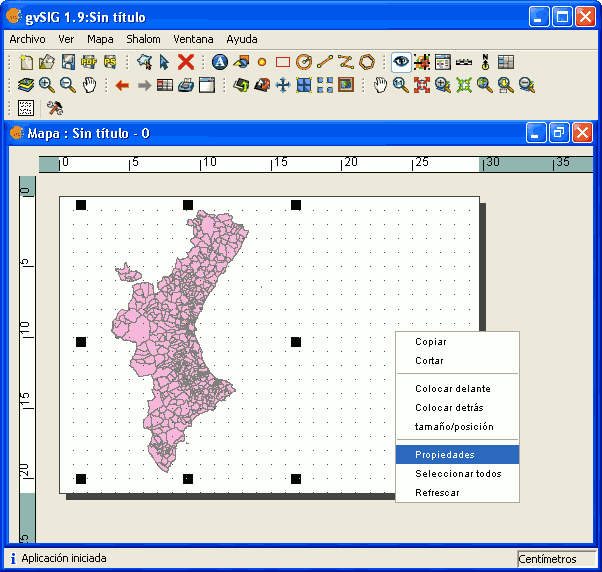
Acceder a Propiedades del mapa

Reconfigurar las opciones del grid
y seleccionaremos la opcion X: 50.000 e Y: 50.000. A su vez, dentro de Símbolo seleccionaremos tipo línea y le daremos un color y un grosor en concreto.
El resultado sería el siguiente:
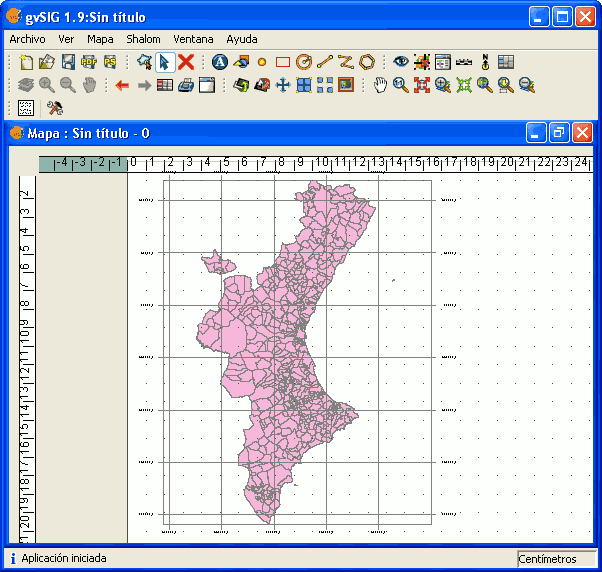
Resultado de un mapa con grid de coordenadas