Document Actions
Description
The Colour table interface allows users to assign specific RGB values to a range of pixel values in a single band image. It is important to note that the input image can only have one band because if there are multiple bands, each of the bands will have colours associated with it. With the colour table functionality, users can build new tables or gradients, or modify existing ones.
The colour table dialog can be launched from the toolbar by selecting the option "Raster layer" on the left drop-down button and "Colour table" on the drop-down button on the right. Make sure that the name of the layer for which you want to build colour tables is set as the current layer in the text box. The "Colour table" option will only be available if a single band image is selected.

Colour table icon
To use this function, it is important to know the minimum and maximum values in the image. If these values are unknown, they will have to be calculated. Depending on the size of the image, this calculation process may take some time. When the Colour table dialog is launched for an image that does not have any colour tables associated with it, all components will be inactive. To get started, we need to tick the check box labelled "Activate color table".
Description of components
The colour table dialog is divided into several parts:
- The central part, which covers most of the dialog, displays the legend associated with the image in tabular or gradient form. (You can switch between table and gradient view by clicking on the tabs.)
- In the lower part are the controls with settings for the tabular and gradient view.
- A preview window is located in the upper right corner of the dialog. Here we can preview the output results before they are applied to the image.
- The library in the lower right corner lists the predefined colour tables. From this list, you can choose a colour table to apply to the image. It is also possible to create a new colour table and add it to the library for future use.
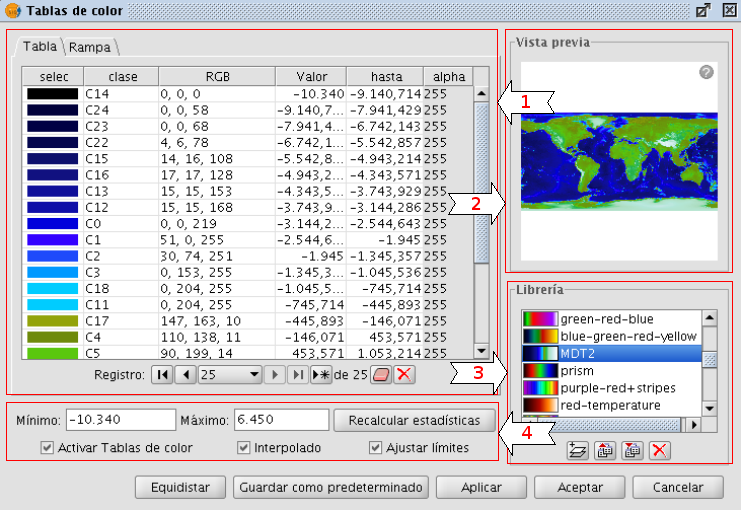
Colour table dialog - Table tab
Tabular view
Every row in the table corresponds to a range of pixel values and its associated RGB colour. The column Value shows the first value of the range and the column To shows the last value of the range. These values can be edited directly by double-clicking on the cell and typing a new value. The RGB column contains the RGB value to be assigned to the range of pixel values. The cells in this column are not editable, but if you want to change the colour you can go to the corresponding cell in the Colour column and click on it. A generic java colour selection dialog will appear where you can modify the colour by changing the RGB values or visually.
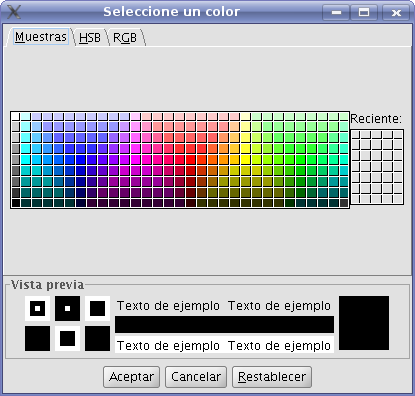
Colour selection
The Class column contains associated labels that will not have any effect on the calculation and are just meant to add descriptive names to the range of values. If there is any text in this column, it will be displayed in the map legend when this is created. The last column labelled Alpha shows transparency values. When clicking on the values, a transparency selection dialog will open.
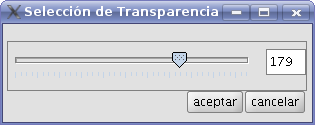
Apply transparency
To manage the rows of the table (add, delete or move) you can use the general table controls located below the table (see the table control description).
Gradient view
The gradient view (which can be accessed by clicking the gradient tab) contains the same information as the tabular view but presented in a different way, and with the possibility to obtain results that are difficult to achieve with the tabular view. The colour bar represents the range of values from minimum on the left to maximum on the right. At the start, the end and on intermediate points on the colour bar are a number of break points with a fixed colour value.

Break point
These break points indicate the colour that will be assigned to the value that falls on that point. A click on a break point will activate the text boxes below the colour bar. These text boxes show the following information about the selected break point:
- Colour: The colour of the break point (which can be modified by clicking on it)
- Class: Label associated with the point. This is the same associated label as in the Class column of the tabular view.
- Value: Pixel value at this break point.
To add a break point, just click below the colour bar. After adding a break point you can modify its information. To remove a break point you can click on it and drag it away.
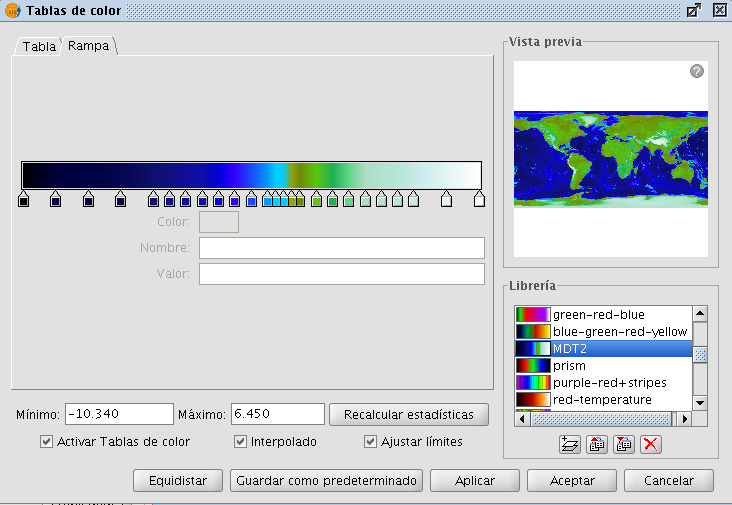
Colour table dialog - Gradient tab
The final result of the gradient will depend on whether the check box labelled as "Interpolated", located below the gradient tab, is ticked or not. This option is available both in the tabular view and the gradient view. When ticked, the transition between one break point colour and the next colour will be gradual. If it is not ticked, the transition will be abrupt. The point where one colour ends and the next colour begins is marked by a diamond-shaped symbol.

Cutoff point
This cutoff point can be moved to the right or the left by clicking and dragging it.
General controls
In the lower part of the dialog are the controls for the tabular and gradient view.
- The text boxes labelled "Minimum" and "Maximum" indicate the minimum and maximum values of the image. We can recalculate these values with the button labelled "Recalc Statistics".
- The check box labelled "Activate colour table" is used to enable or disable the use of colour tables for the current layer.
- Ticking the check box labelled as "Interpolated" will result in a smoother transition between the colours of two ranges of pixel values. This means that instead of assigning a fixed colour to the whole range of pixel values, the RGB colour value of the intermediate pixel values will be the result of an interpolation of the first colour in the range, the last colour in the range and the relative position of the pixel value. If you disable this check box, the transition between colours will be abrupt.
- The check box labelled "Limits adjust" is used to adjust the ranges to the maximum and minimum values of the image. If this is turned off, the colour table will be applied to the whole range of values which is 0 to 255 by default.
- Clicking the button "Middle distance" will result in break points that all hold the same distance between them (they will be equally spread over the colour bar). The first and last values of the range of pixel values will be modified accordingly in the tabular view.
- When clicking the button "Save as Default", the current colour table will be set as the default colour table for this image. The colour table information will be saved as a metadata file (.rmf) with the image, and the next time that the image is loaded in a gvSIG view it will have this colour table associated with it by default.
Library of colour tables
gvSIG provides a list of predefined colour tables to which you can add others that you have built yourself. Located at the lower right part of the Colour table dialog, the colour table libary allows users to scroll through and manage colour tables. The list of colour tables can be displayed in three ways: List, SmallIcon and LargeIcon. The type of display can be changed by right-clicking on the list, after which a drop-down menu appears where you can select the display mode.
List:
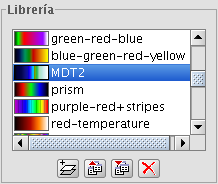
Colour table library - List display mode
SmallIcon:
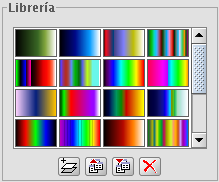
Colour table library - SmallIcon display mode
LargeIcon:
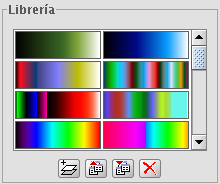
Colour table library - LargeIcon display mode
Below the colour table library are buttons to add, export, import and delete colour tables
- When clicking on the button with the tooltip "New library", a dialog opens which prompts for basic information of the colour table: the name, minimum value, maximum value and the intervals. The default minimum and maximum values are 0 and 255. In principle there is no need to change these values because the colour table is automatically set to the value range of the image to which it is applied. The intervals can be specified by two different methods. The first method is by defining an interval of values, after which the number of intervals is calculated for the whole range of values. The second method is to specify the number of intervals, after which the size of the intervals is calculated automatically.
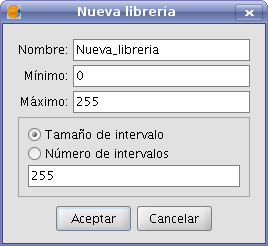
Create new colour table
- To remove colour tables press the button with the tooltip "Delete library". You will be prompted for confirmation before the selected colour table is deleted.
- You can export a colour table in one of the supported formats. Currently, only .rmf y .ggr y .gpl of Gimp are supported.
- You can import a colour table in one of the supported formats. Currently, only .rmf y .ggr y .gpl of Gimp are supported.
Legend in the view and map
The colour table built with this tool will classify the image in ranges of data values. When accepting the colour table dialog settings, this classification is shown in the TOC just below the layer name. For each colour, the corresponding range of values and the associated label, if any, is shown as a legend.
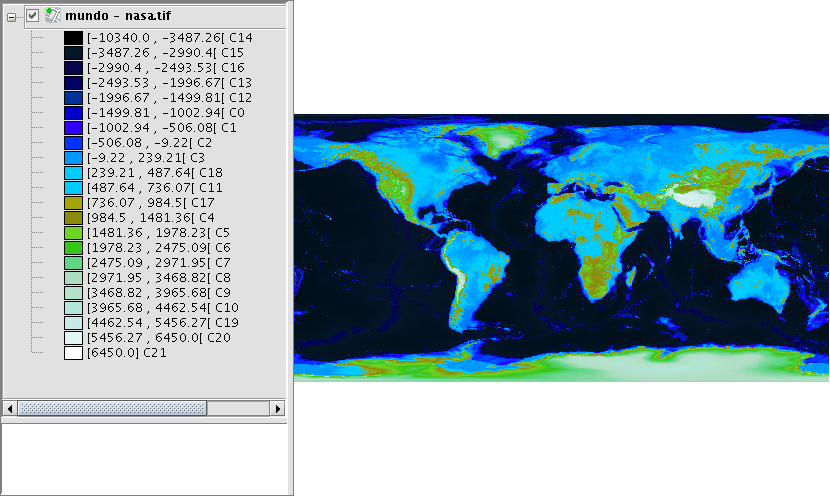
Legend in the ToC according to the colour table of the image
The generated legend can be inserted when preparing a map.
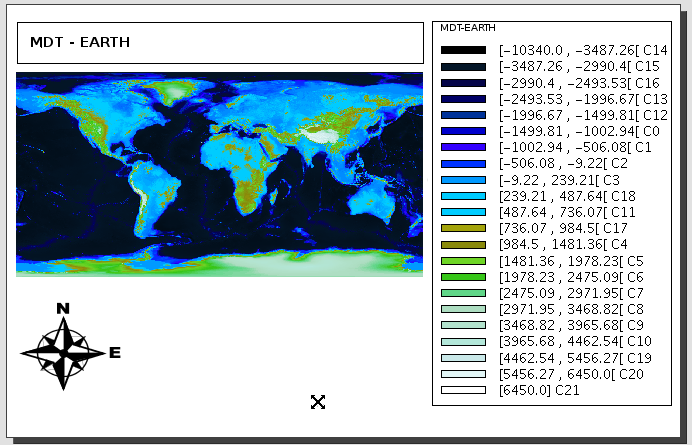
Map with view and legend inserted


