Document Actions
Introduction
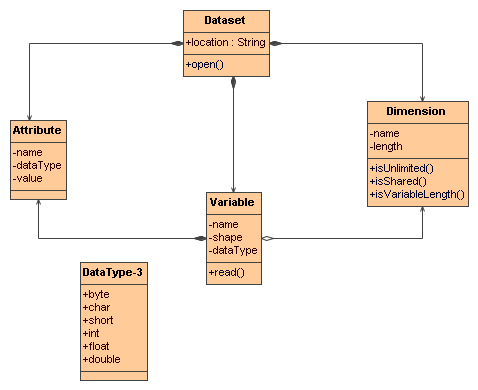
The explication of the NetCDF format has been retrieved of the NetCDF web site [2]. The classic netCDF data model consists of variables, dimensions, and attributes:
- Variables: N-dimensional arrays of data. Variables in netCDF files can be one of six types (char, byte, short, int, float, double). They are used to save physical quantities (pressure, temperature).
- Dimensions: describe the axes of the data arrays. A dimension has a name and a length. An unlimited dimension has a length that can be expanded at any time, as more data are written to it. NetCDF files can contain at most one unlimited dimension.
- Attributes: annotate variables or files with small notes or supplementary metadata. Attributes are always scalar values or 1D arrays, which can be associated with either a variable or the file as a whole. Although there is no enforced limit, the user is expected to keep attributes small.
Next picture (from [1]) shows the relationship between these objects:
The variables are defined using one or more dimensions, but not all the variables are defined using the same dimensions and by this reason the mapping between the NetCDF data model and the gvSIG data model has been quite difficult. To illustrate the solution for this problem, we are going to use a NetCDF example with this structure:
- Dimensions:
- lat (length 10)
- lon (length 4)
- time (length 5)
- Variables
- pressure (lat, lon, time)
- temperature (lat, lon, time)
- sensor_quality (lat, lon)
- sensor_time_interval (lat, lon)
This example has 4 variables, two defined using three dimensions and other two defined using two dimensions. The pressure variable has been defined using lat, lon and time: it means that there are 200 (10 x 4 x 5, the length of the three dimensions) different values for the pressure. There is a different value for any combination of lat, lon and time. The temperature also is defined using the same dimensions and it also has 200 possible values.
But the sensor_quality and the sensor_time_interval are defined using the lat and lon dimensions. It means that there are 40 values for these variables (10 x 4).
In the example there are two variables with 200 values and other two variables with 40 values How is possible to transform this structure to a table? The solution has been to group the variables defined using the same dimensions and display them in different tables.
The FeatureStore [3] is able to contain more that one FeatureType [4] and every FeatureType has its own structure of attributes. In the proposed example the resultant store has two FeatureType's: the first one with the attributes pressure and temperature and the second one with the attributes sensor_quality and sensor_time_interval.
- [1] https://gvsig.org/web/projects/gvsig-desktop/docs/devel/org.gvsig.fmap.dal/2.0.0
- [2] http://www.unidata.ucar.edu/software/netcdf/
- [3] http://gvsig-desktop.forge.osor.eu/downloads/pub/projects/gvSIG-desktop/docs/reference/org.gvsig.fmap.dal/2.0.0/apidoc/org/gvsig/fmap/dal/feature/FeatureStore.html
- [4] http://gvsig-desktop.forge.osor.eu/downloads/pub/projects/gvSIG-desktop/docs/reference/org.gvsig.fmap.dal/2.0.0/apidoc/org/gvsig/fmap/dal/feature/FeatureType.html
- [5] http://gvsig-desktop.forge.osor.eu/downloads/pub/projects/gvSIG-desktop/docs/reference/org.gvsig.fmap.dal/2.0.0/apidoc/org/gvsig/fmap/dal/DataServerExplorer.html


