Document Actions
Layer's properties
Properties
From the gvSIG's TOC, display the context menu (right click on the layer's name) and select the option NetCDF Properties. Clicking on this option opens the window for the properties of that layer.
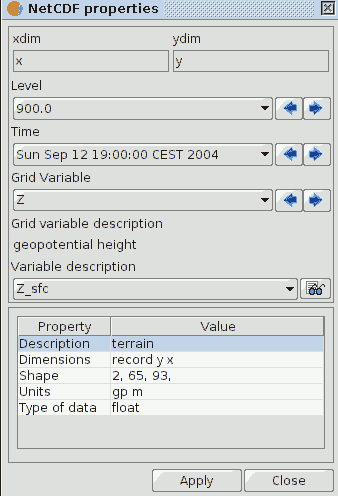
NetCDF properties' window of the layer.
In order of appearance we have the following options:
- ** xdim and ydim variables**: these variables are merely informative and can not be modified by the user. From these values it is determined the NetCDF file extension.
- Level: This property refers to the level of the selected data from the Variable Grid to be displayed in the geographical view. Depending on the configuration of the layer, the user will have available more or fewer levels.
- Time: from that list you can select the date for which data is displayed in the Variable Grid selected. Thanks to the arrow controls, the differents dates can be passed to back and forth sequentially. Depending on the configuration of the layer, the user will have more or less dates available for the selection.
- Grid variable: this is the variable that defines the data to be displayed. These data can be of type: char, byte, short, int, float, double, unsigned int types, strings, compound types, variable length arrays, enums, and opaque. For example, for a variable of elevation type (coordinates Z) the values must be defined in a variable of type double.
- Grid variable description: description of the meaning of the grid variable
- Description of the variable: this list of values has all the available variables defined in the NetCDF file and loaded in gvSIG. To access the description of each, select it from the list and click on the button to the right of the combo list. This will display a table whose columns are the Property and Value to report on the description of each variable.
Variable selection
Once you select different values from those lists of variables Level, Time or Grid Variable, the view will be refreshed to provide the display of such information.
In addition, in the directory where the file is saved, gvSIG generates the corresponding XML files containing the statistical data sets that are being viewed at any time. Thus, for example, where originally had only the file rhum.2003.nc, after having displayed a number of Levels and Times for the grid variable defined as rhum, we have a set of .rmf files (Raster Meta File), as shown in the picture below.
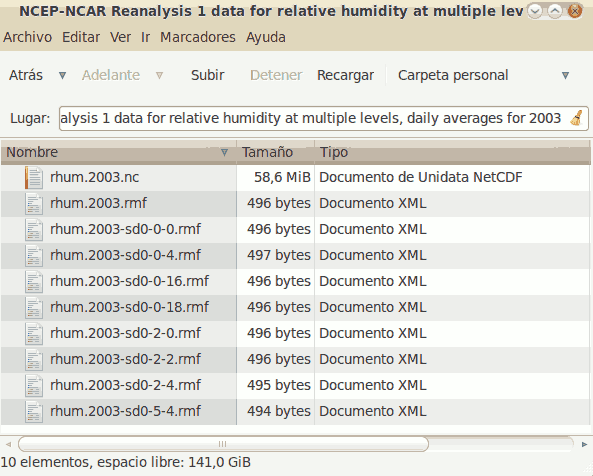
List of .rmf files containing the statistics about the displayed data.
As a criterion for numbering, on the generic filename-sdx-y-z you have:
- sdx: letters sd are refering to SubDataset, to denote the subset of data from the file .nc. The digit next to these letters indicate the position of the grid variable displayed, respect to the list of grid variables available in the file. Remember that the list numbering starts at zero.
- y: This number indicates the position of the chosen value of the Level variable list available for displaying the data. Remember that the list numbering starts at zero.
- z: This number indicates the position of the chosen value of the Time variable list available for displaying the data. Remember that the list numbering starts at zero.
Each file created has the statistics of the subdataset displayed on the view.
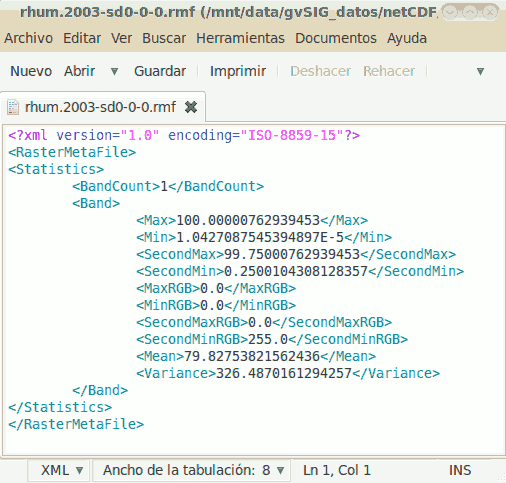
XML statistics file's content created.


