


Document Actions
gvSIG-Desktop 1.12. User manual
gvSIG 1.11 User manual - Viewing and accessing data - Symbology - Vector - Legend types - Multiple attributes - Pie legend - Draw pie charts for selected geometries only
This option is used to restrict the drawing of pie charts to selected geometries.
The geometries can be selected either before or after configuring the pie chart size and display options.
In order to represent pie charts for selected geometries, simply activate the check box Draw only selection in the pie legend configuration dialog.

Check to display pie charts for selected geometries only
The following image shows an example in which pie charts are only shown for selected geometries (shown in yellow).
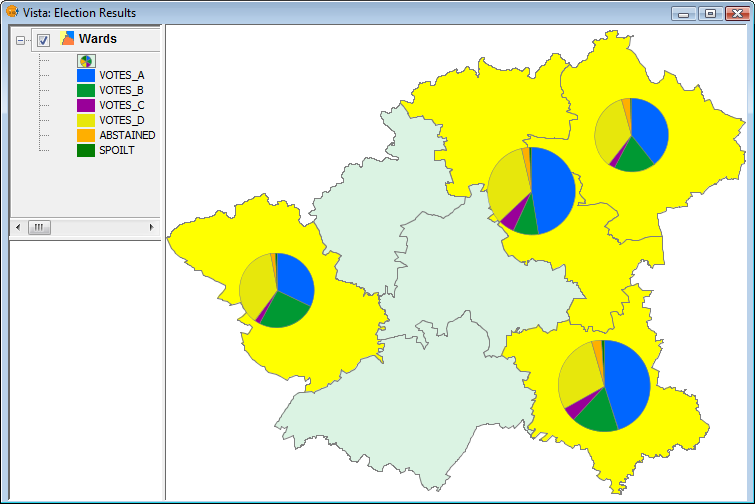
Example showing pie charts for selected geometries
Cached time 11/21/13 14:57:38 


