gvSIG-Desktop 1.12. Manual de usuario
Click the 'Size' button located in the bar legend configuration screen.

Bar Legend. Size button
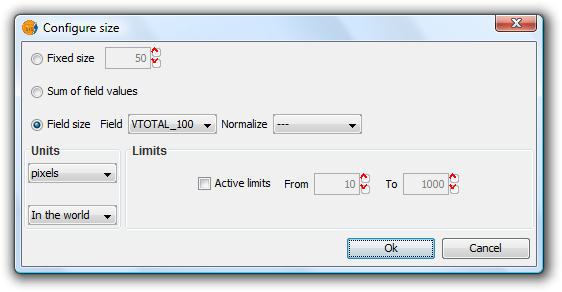
Clicking this will open the following dialog:

Bar Legend. Configuring size
There are three options for setting the size of the diagrams:
- Fixed Size: The largest bar will drawn to this size, and the rest will be drawn proportionately.
- Sum of field values: The size of the bars will be determined by the sum of all the records in the fields making up the chart.
- Field size: The size is obtained from the selected field and can be normalized if so desired. For example, a chart could be drawn to represent the number of votes for each political party by the size of the bar, while the overall size of the diagram could be determined by another field, such as number of habitants. In this example, the size of the graph would be larger for areas of greater population.
In addition to setting the size of the bars, the units can also be specified.
Units: Select units (meters, pixels ...) and representation (in the world or print layout), depending on your requirements. If the units are set to "in the world" then the size will depend on the View's zoom level, while selecting "print layout" results in a fixed size, both on the screen and when printed.
Active Limits: Limits can be specified if the size of the chosen field size is not set to the "Fixed Size" option.
Activating limits for the other options sets the minimum and maximum values of a particular measure (Sum of field values or Field size). Taking the limits into account, the intermediate field values are calculated in proportion to the values of the records of the field, or to the sum of the field values.


