


Document Actions
gvSIG-Desktop 1.9. New functionalities
Views
Consulting tools
Herramienta de información rápida
In gvSIG, this tool is used to quickly display available information when working with a view containing visible vector layers (including WFS layers, which are vector layers).
 Quick Info is enabled if vector layers are visible in the current view.
 Quick Info is disabled if no vector layers are visible in the current view.
With this tool you can select fields from vector layers visible in the current view. Information from these fields is displayed as you move the mouse cursor over the view. The tool works in combination with any other tools selected for the view.
You can access the Quick Info tool in two ways:
- Via the menu: View → Query → Quick Info
- Via the icon on the toolbar.
When the tool is selected a progress bar is displayed which shows the layers being loaded:
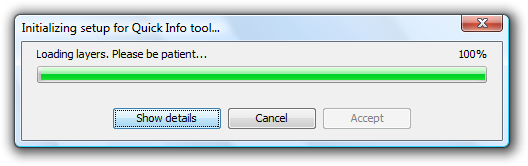
Progress bar for loading information
If there were no problems loading the information the Quick info field selection dialog is shown:
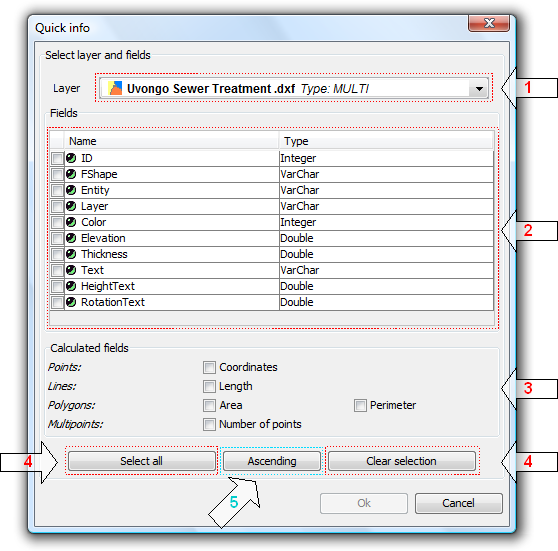
Dialog for the selection of fields
- Drop-down list for selecting vector layers. Lists the layers in the order that they appear in the TOC of the active view. The following information is shown:
Level of the Layer in the TOC: displays icons and grouping nodes  containing the layer. The last icon always represents the vector layer.
Name of the layer.
Type of geometry of the layer: five types of geometry layer are supported: point, line, polygon, multipoint, and multi (the latter may contain any of the above).
- List of Fields. Contains three columns:
- Selection box (checkbox): indicates whether or not to display the field information.
- Field Type + Field Name: the field type is represented by an icon as shown in the following table:
 The field type is simple.
- The field type is complex.
- Type of field: according to the SQL types.
- Calculated fields. List of checkboxes to select which geometry fields to calculate. These vary depending on the geometry of the layer:
- Point layer: point coordinates.
- Line layer: length of the line.
- Polygon layer: perimeter and area of the polygon.
- Multipoint layer: number of points.
- Multi-geometry layer: any of the above; the information will vary according to the selection and the nature of the geometry.
 The units of length and area are displayed using the measurement units of the View.
- Selecting / de-selecting all the fields in the layer. Select or de-select all the fields in the layer.
- Sort fields. Sort fields alphabetically in ascending or descending order, or according to the internal order of the layer (default).
After selecting the fields, click Ok to enable the tool in the current view. The Quick info tool works in combination with Quick info tools for other Views. Thus, when enabled, it combines with each active View to display information. The tool settings can be changed for each View and are linked to that View.
As the cursor is moved over the geometry of a layer, the information box showing the information is displayed and/or updated. This box disappears when the cursor no longer "points" to any geometry of the layer.
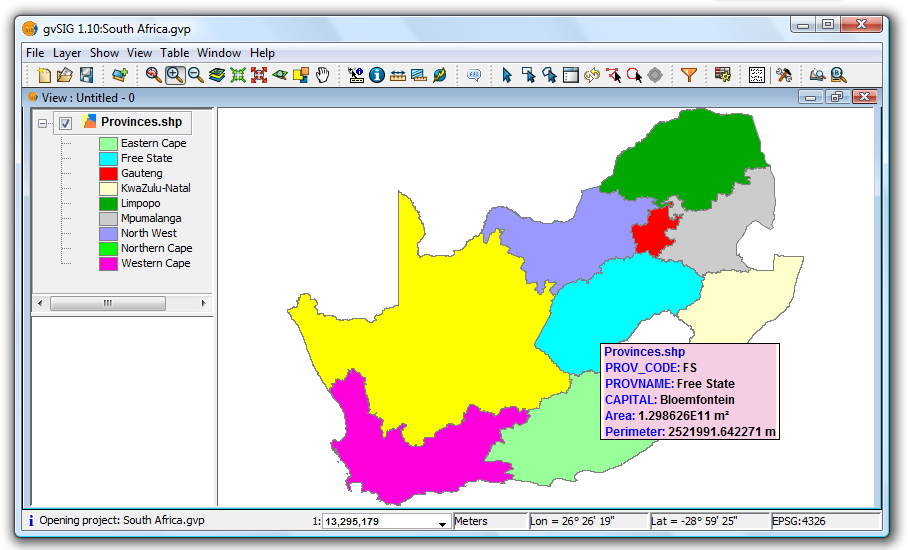
Example showing the display from the Quick info tool
If there is more than one geometry adjacent to the point indicated by the cursor then information is displayed about all of them, as distinguished by the unique internal identifier of the geometry.
Thus, the information is provided in the following order:
- Name of the layer.
- Information on the geometry (for each one):
ID: unique identifier of the geometry in the data source layer (optional, only visible if you have information on more than one geometry).
Selected fields: those fields selected to display layer information.
Optional fields: those calculated fields selected from the geometries of the layer.
 It should be noted that currently gvSIG adds the area and perimeter of islands to the geometry containing them.
Hiperenlace avanzado
The Advanced Hyperlink tool in this version of gvSIG significantly extends the functionality of the hyperlink tool found in version 1.1.
The tool is accessible either from the Layer menu (Layer > Advanced Hyperlink) or by clicking the icon on the toolbar.
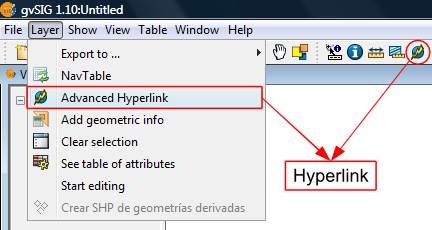
Accessing the Hyperlink tool
Hyperlinks are configured at the layer level, which means that they can be enabled or disabled per layer. To set the hyperlink for a layer, double-click on the layer name in the TOC to open the Layer Properties and select the Hyperlink tab.
The hyperlink configuration screen looks like this:
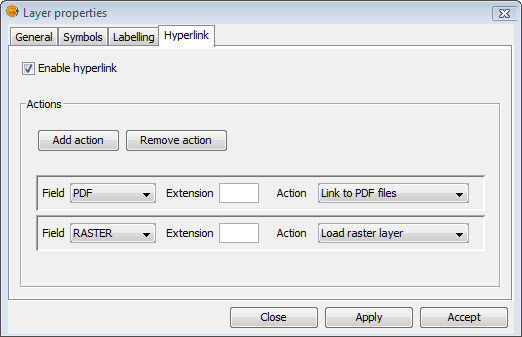
Hyperlink Configuration
Remember that the layer's attribute table must be correctly prepared for the hyperlinks to work. To do this, edit the relevant record and insert the path to the hyperlinked file, leaving out the extension.
After the hyperlinks have been setup and enabled, select the Advanced Hyperlink tool and find the item in the View that corresponds to the record associated with the link. Click on the item and a window will open displaying the linked file.
Actions
The Advanced Hyperlink tool provides the following actions:
- Link to text and HTML files: the tool will open a window in gvSIG and load the linked text or HTML document into it.
- Link to image files: the tool will open a window in gvSIG and load the linked image into it.
- Link to PDF files: the tool will open a window in gvSIG and load the linked PDF document into it.
- Load raster layer: the tool loads the raster layer into the active View.
- Load vector layer: the tool loads the vector layer into the active View.
- Link to SVG files: the tool will open a window in gvSIG and load the linked SVG file into it.
NOTE 1: When editing the hyperlink fields in the attribute table, if a path longer than the maximum field length is entered, the path will be truncated (without warning) to the maximum field length. By default, fields are created with a maximum length of 50 characters. Fields should be defined to handle long paths when necessary, otherwise only very short paths can be stored.
For example: if we enter
C:/Documents and Settings/My documents/images/villafafila.jpg
and the maximum field length is 50 characters, the path will be truncated to:
C:/Documents and Settings/My documents/images/vill
which is not what is wanted.
NOTE 2: Please note that if the path you enter contains an image or file extension that is registered in the registry, you should not also enter it when configuring the hyperlink properties as this would be duplicating the information.
Selecting tools
Selección de elementos
SELECT ALL
This tool is enabled when one or more vector layers are active in the TOC. The tool selects all the geometries (features/elements) in the active vector layers.
 "Select all" tool enabled if there are active vector layers in the current View.
 "Select all" tool disabled when there are no active vector layers in the current View.
The tool is accessed via the menu:
- View -> Selection -> Select All
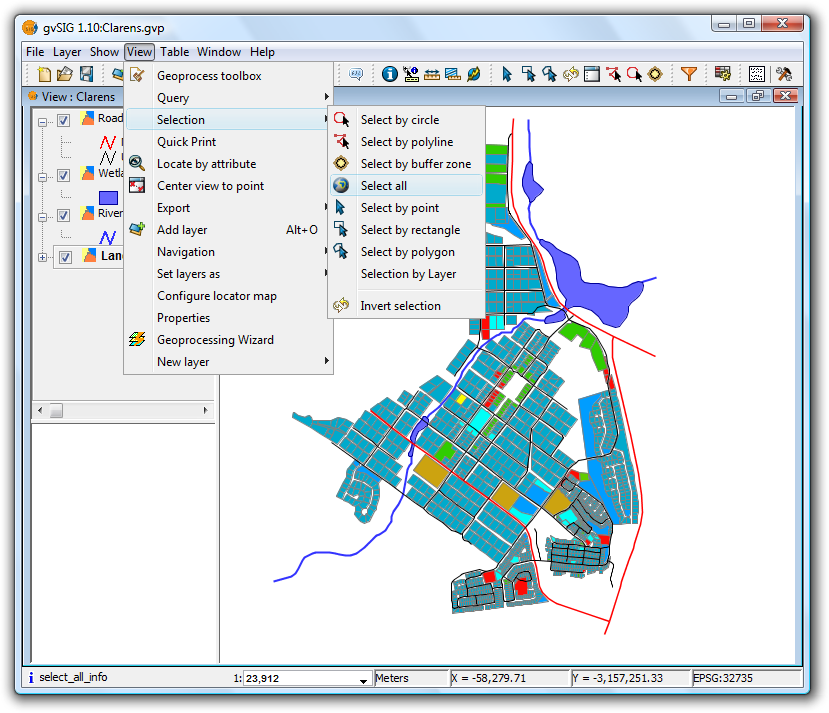
Menu location of Select All tool
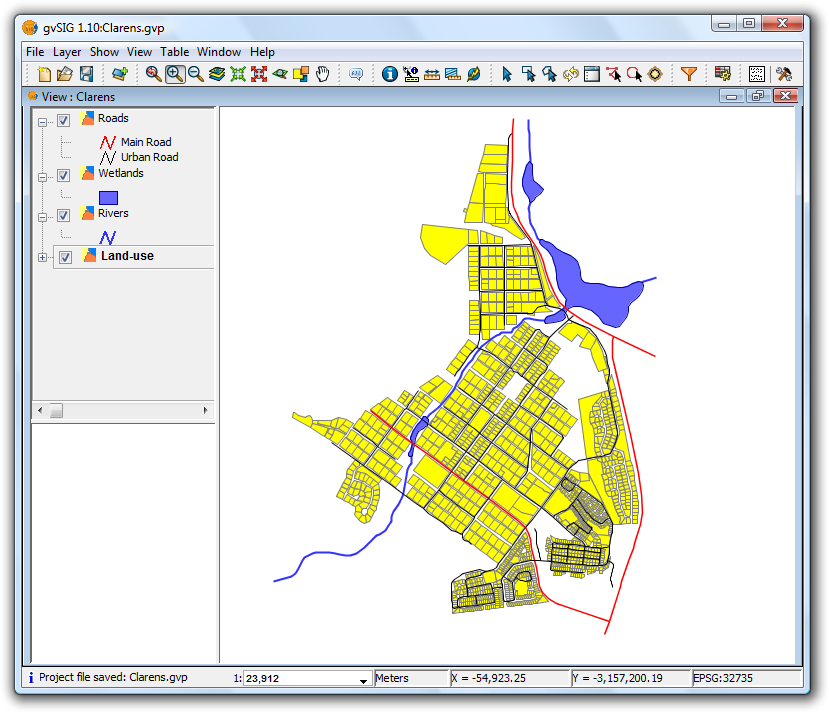
Result of selection
 The tool is not available if the layer is being edited.
SELECT BY POLYLINE
This tool is enabled when there is at least one active vector layer in the TOC.
 "Select by polyline" tool enabled if there are active vector layers in the current View.
 "Select by polyline" tool disabled if there are no active vector layers in the current View.
This tool selects those geometries of the active layers that intersect the polyline defined by the user.
The tool can be accessed in two ways:
- Via the menu: View -> Selection -> Select by polyline
- Via the icon on the toolbar
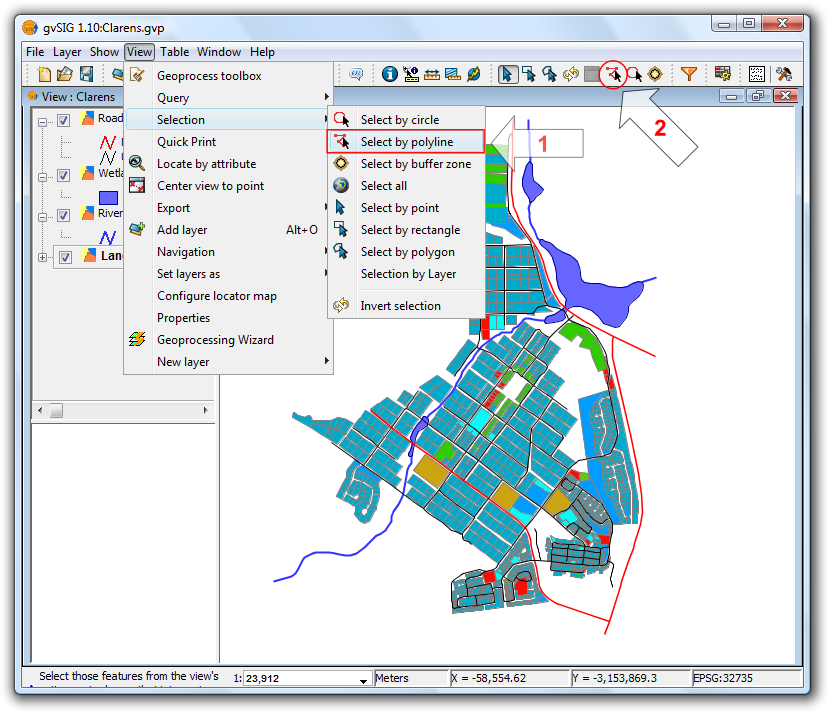
Location of the Select by polyline tool
With the tool selected, move the mouse over the View and enter a series of clicks to define the polyline. Double-click to end the polyline.
Selection using a polyline
 You can use any mouse button to define the points of the polyline, including the final point.
If another polyline is created while holding down the Ctrl key then the geometries thus selected are added to those already selected. If, while doing this, a previously selected geometry is selected again then it will be deselected.
Result of the selection
SELECT BY CIRCLE
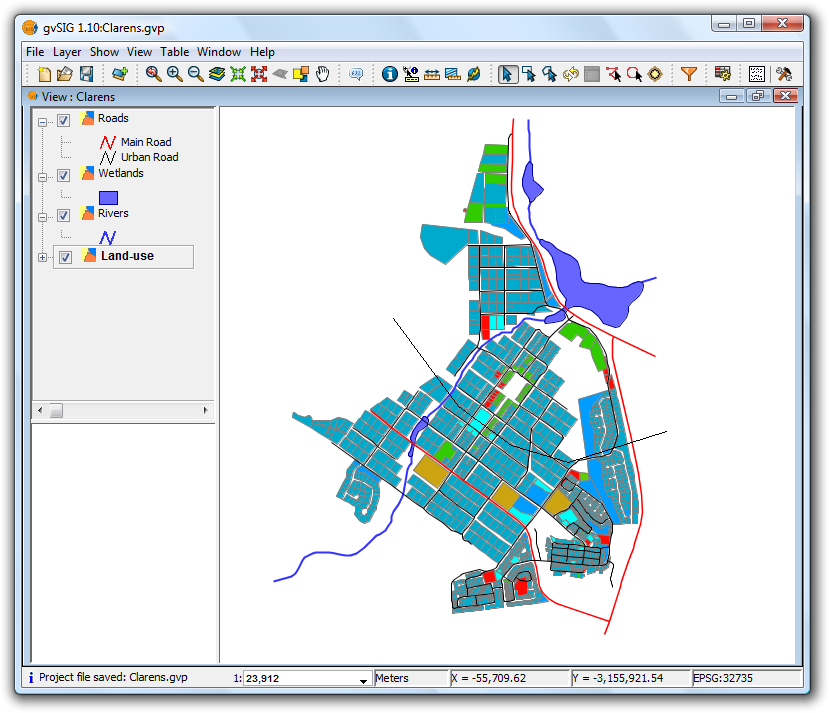
This tool is enabled when there are one or more active vector layers in the TOC.
This tool selects geometries (features) of the active layers that intersect the circular area defined by the user.
 "Select by circle" tool enabled if there are active vector layers in the current View.
 "Select by circle" tool disabled if there are no active vector layers in the current View.
The tool can be accessed in two ways:
- Via the menu: View -> Selection -> Select by circle
- Via the icon on the toolbar
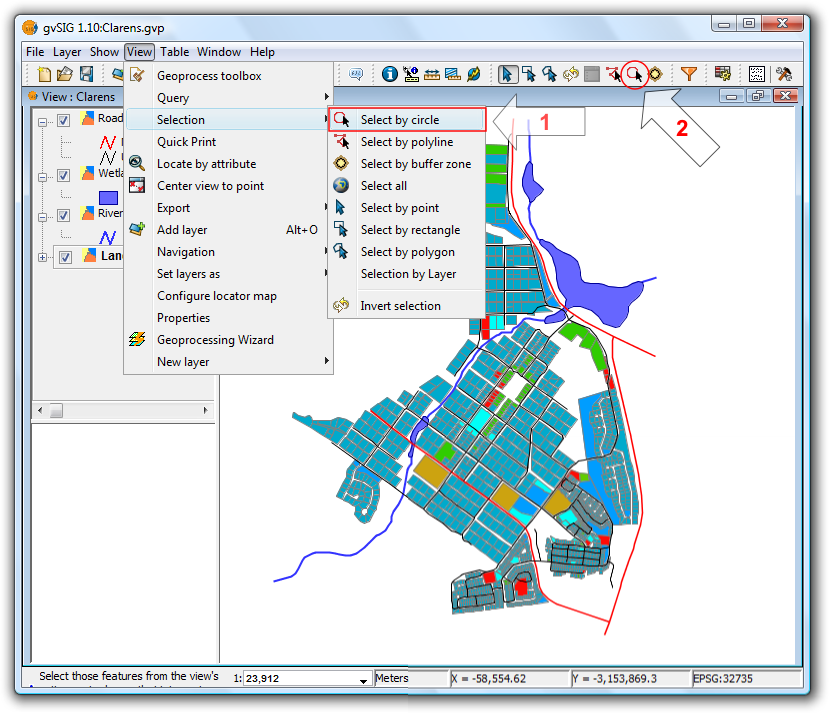
Location of the Select by circle tool
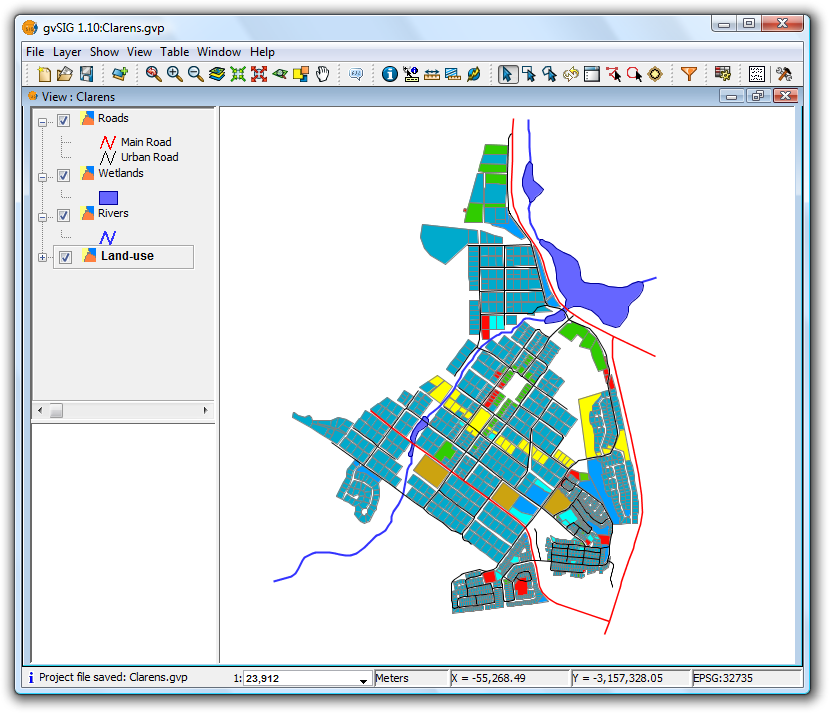
In the View click the mouse at the centre of the circle and then move the mouse outwards to define the size of the circle. Click once to finish drawing the circle.

Selection using a circle
Another circle can be defined while holding down the Ctrl key to add new geometries to those already selected. Previously selected geometries selected again in this manner will be deselected.
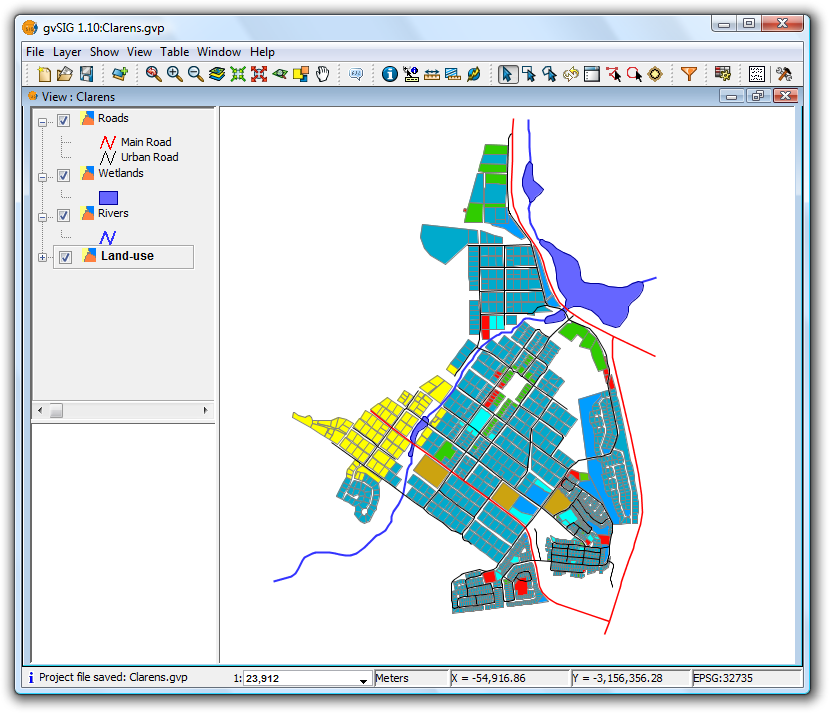
Result of the selection
SELECT BY BUFFER ZONE
This tool is enabled if there is at least one active vector layer in the TOC.
 "Select by buffer zone" tool enabled if there are active vector layers in the current View and these layers have plane coordinates.
 "Select by buffer zone" tool disabled if there are no active vector layers in the current View with plane coordinates.
This tool selects geometries of the active layers that intersect buffer zones around selected geometries.
The tool can be accessed in two ways:
- Via the menu: View -> Selection -> Select by buffer zone
- Via the icon on the toolbar

Location of the Select by buffer zone tool
- Tool requirements
- Vector layers must be active in the TOC
- The selection does not apply to layers with geographical coordinates, only to layers with plane coordinates (e.g. UTM)
- Geometries must be selected in at least one layer
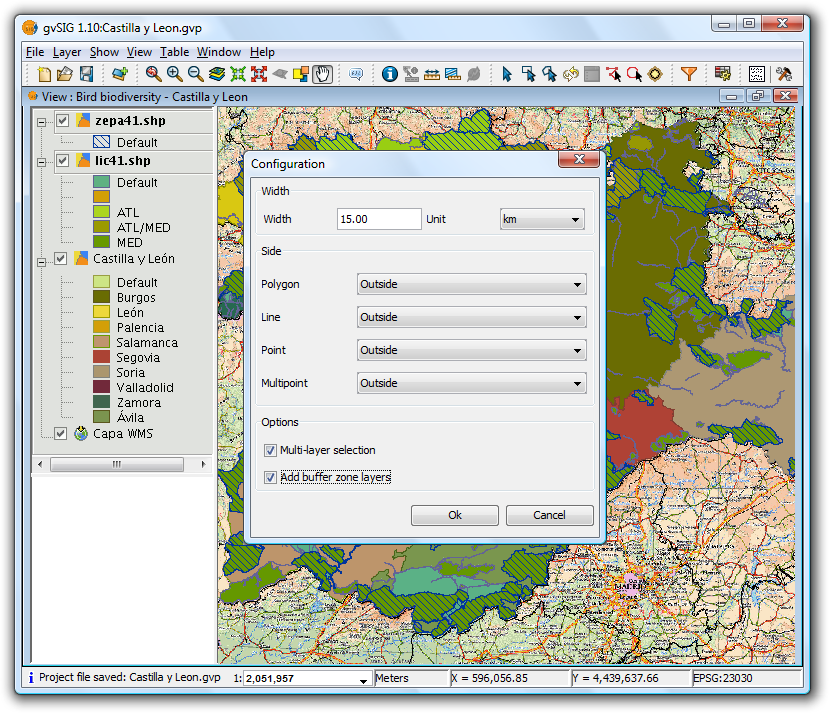
- Configuration panel
When the tool is selected the following configuration panel is displayed:
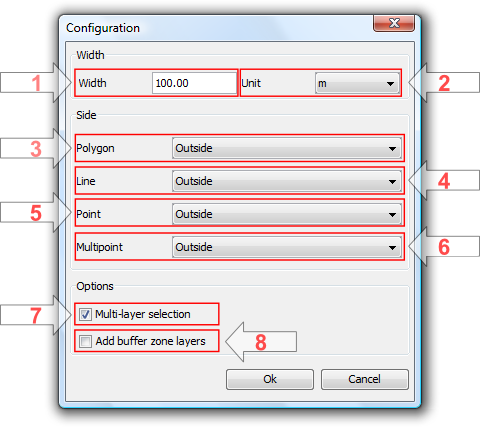
Configuration options
- Width: width of the buffer zone.
- Unit: units of the buffer zone width.
- Polygon: which side of the polygon to generate the buffer zone:
- Outside: to the outside of the polygon.
- Inside: to the inside of the polygon.
- Line: for line layers the buffer zone will always be towards the outside.
- Point: for point layers the buffer zone will always be towards the outside.
- Multipoint: for multipoint layers the buffer zone will always be towards the outside.
- Multi-layer selection: the selection will apply to all layers that meet the requirements.
- Add buffer zone layers: when selected this option adds the generated buffer zone(s) to the View's TOC.
The new layers are named as follows:
- influence_areas_layername_num
- influence_areas -> prefix to identify this type of layer.
- layername -> name of the layer for which the buffer zone is calculated.
- num -> numerical suffix to identify each new buffer zone layer that is generated, automatically increased for each new zone generated from a single layer, starting from zero.
Example
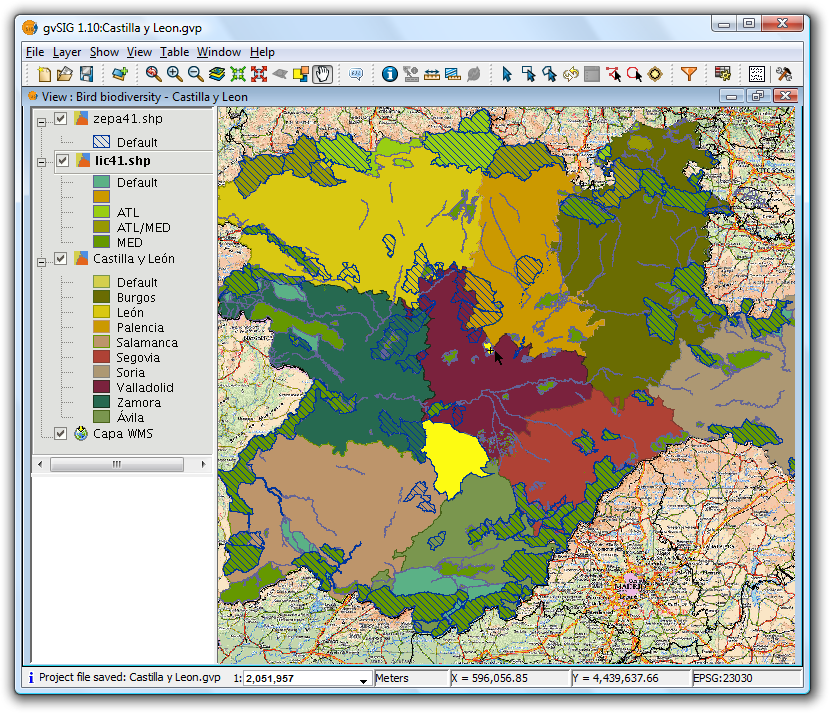
Let's look at a typical example using the "Select by buffer zone" tool and four layers:
- A shape layer showing "Bird Special Protection Areas" of Castilla y León, obtained from the Ministry of Environment, symbolised with a filled "unique symbol" and with a transparency setting (zepa41):
http://www.mma.es/secciones/biodiversidad/banco_datos/info_disponible/zip/zepa41.zip/
- A shape layer showing "Sites of Community Importance" in Castilla y León, obtained from the Ministry of Environment, and using a unique values symbology:
http://www.mma.es/secciones/biodiversidad/banco_datos/info_disponible/zip/lic41.zip/
- A shape layer shape showing the provinces of Castilla y León, using a unique values symbology.
- A background WMS layer showing hydrographic information, topography, geology, road networks and administrative boundaries in Spain:
WMS Server: http://www.idee.es/wms/PNOA/PNOA/
Layer: PNOA
Style: Default
Format: image/png with transparency and SRS=23030
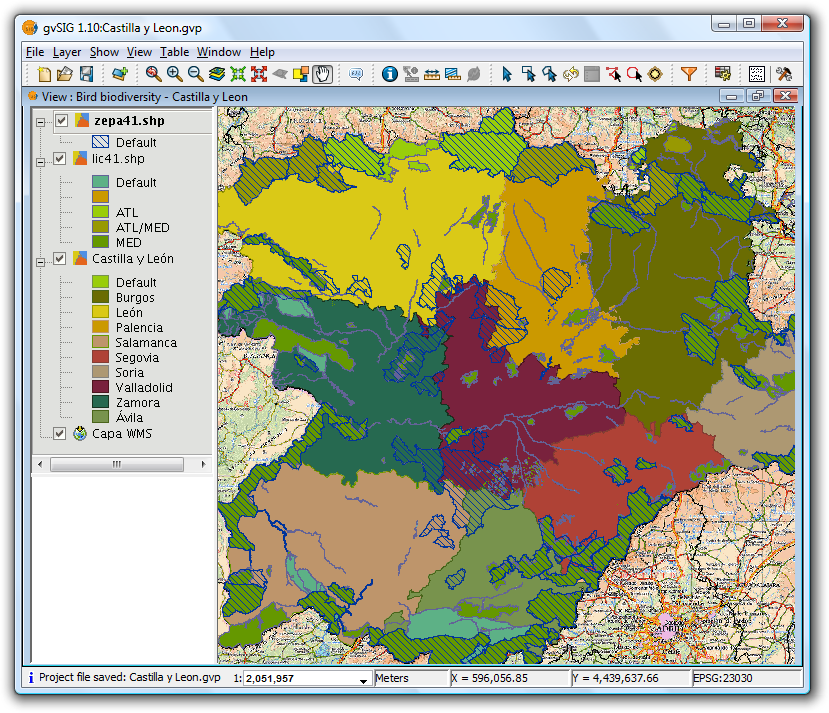
View showing the vector layers, with the Bird Protection Areas layer active
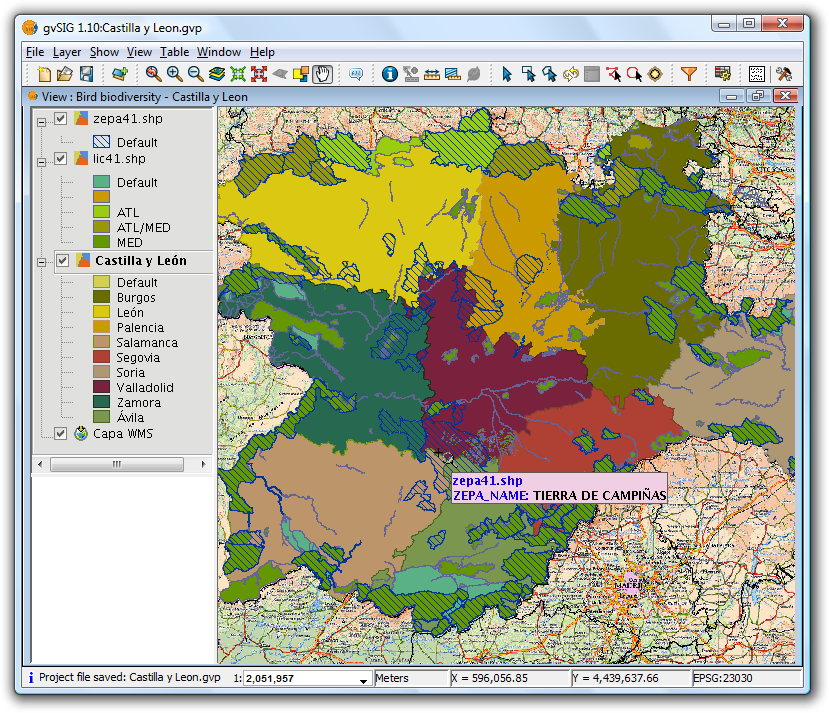
Now select the bird special protection area called "Tierra de Campiñas", which belongs to Valladolid, Ávila and Salamanca. Also select the Site of Community Importance called "Montes Torozos y Páramos de Torquemada – Astudillo" in Valladolid.
View showing the vector layers, with the provinces layers active
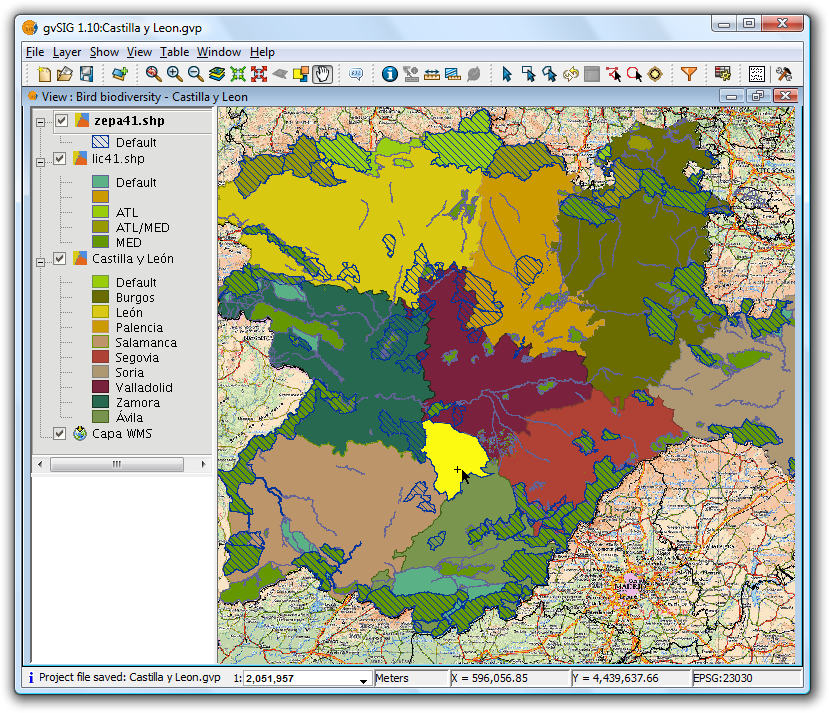
Manual selection of one of the polygons
Make the lic41 layer active
Finally, we want to find the areas of type "lic" and "zepa" close to (up to 15 km) the selected areas so that, for example, they can be taken into account in a future second phase involving work to protect birds.
Set options for the buffer zone
The following settings have been applied:
- The zepa41 and lic41 vector layers have been made active.
- Width is set at 15 kilometers.
- The two selected layers are polygon layers, and for this example the buffer zone is set to be outside the polygons.
- Indicate that the selection should be applied to each active layer (Multi-layer selection).
- Finally, add the generated buffer zones as new layers.
The result is shown in the following screenshot. The buffer zones can be turned off so that the selected areas can be seen.
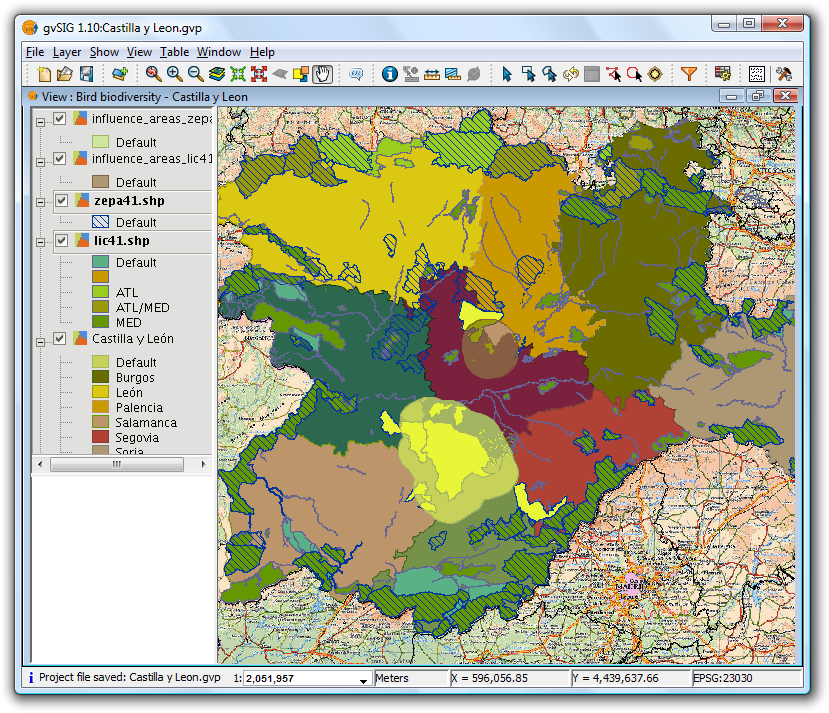
Result of selection by buffer zone
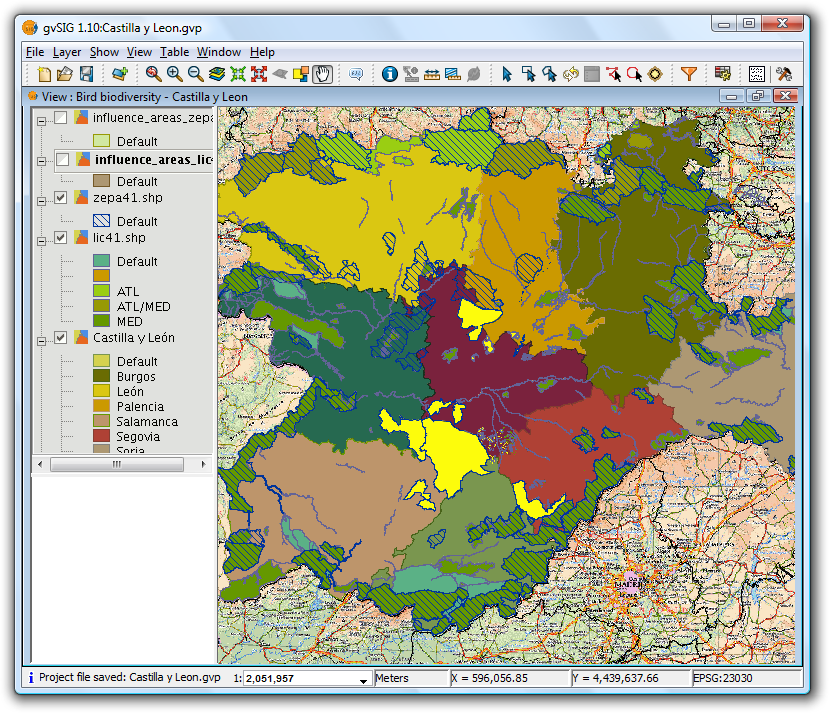
Result with buffer zones switched off
- Details of the process
Click the "Show Details" button below the progress bar to show information on the steps that have been performed, including failures.
Sample output from the above process:
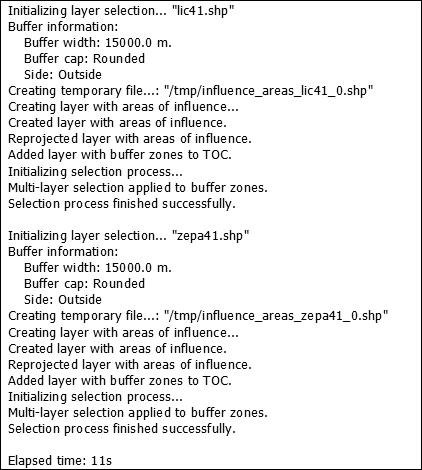
Sample output
Selection is applied to each active layer that meets the requirements.
If the "Multi-layer selection" option is active, then for each buffer zone selections are applied to those layers that also meet the requirements.
If the projection of the layer is not the same as that of the View, an internal reprojection is performed in order to compute the buffer zones. The projection is later restored.
A shape layer is created (one for each active layer that meets the requirements) for storing the buffer zones. The location of each new layer is shown in the line beginning "Creating temporary file".
If the "Add buffer zone layers" option is selected, then the temporary layers are created and added to the TOC, symbolised with a unique symbol and with transparency.
If an active layer is not projected, then the applied selection is discarded.
If a failure occurs, the user is alerted and the selection process is terminated.
 If the process is cancelled, the previous selection state in the affected layers is restored.
Herramientas de transformación de datos
Crear shape de geometrías derivadas
"New layer with derived geometries" tool.
This tool allows users to generate geometries derived from points or lines in a vector layer, and to store them as a new shape layer.
| Icon | Description |
|---|---|
 |
Derived geometries tool enabled if the TOC contains at least one visible point or line vector layer that is not in edit mode. |
 |
Derived geometries tool disabled if the TOC does not contain any visible point or line vector layers that are not in edit mode. |
The tool can be accessed from:
Via the menu: Layer / Derivative geometries
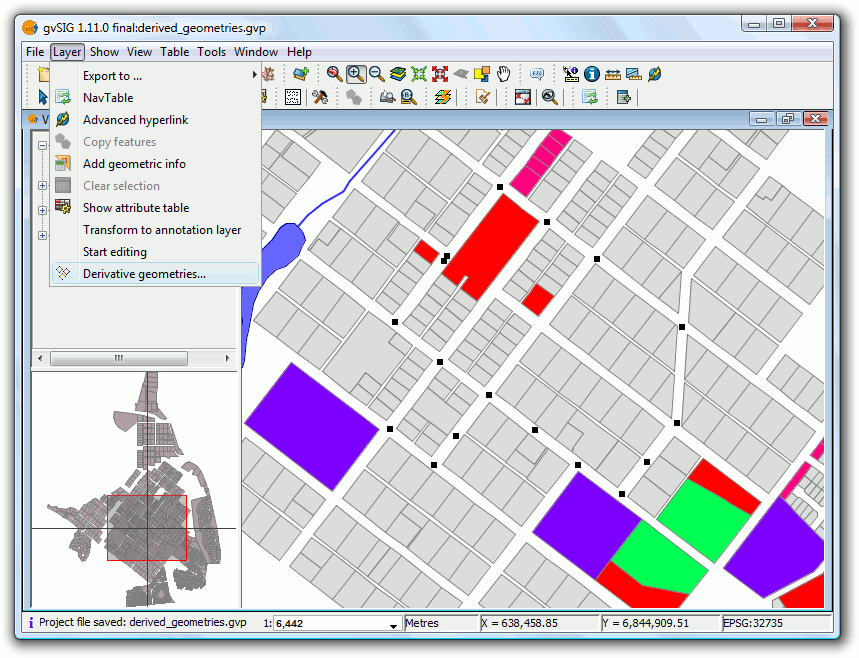
Menu path to the tool
Layer selection dialog and process
Upon choosing the tool a dialog for selecting layers is displayed:
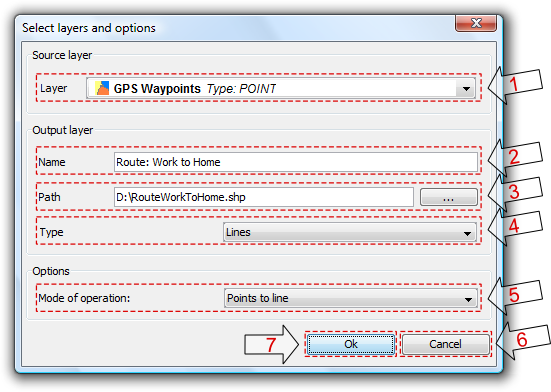
Selecting layers and process
- Source Layer: drop-down list of point or line vector layers in the current View that are not in edit mode. Select a layer to be the source layer.
- Name of the output layer: layer name that will appear in the TOC.
- Path of the output layer: full path for creating the new shapefile.
- Type of output layer: geometry type of the new layer. This depends on the type of process chosen (See options below).
- Type of process: select the type of geometry generation process. This depends on the geometry of the source layer. This process is applied to the source and destination layer pair until the tool is closed.
- Cancel: Close the tool.
- OK: Opens a control panel and displays data for the selected source layer. This control panel will be associated with source and output layers until it is cancelled.
| Source layer geometry type | Type of process | Target layer geometry type |
|---|---|---|
| Points | Points to line | Lines |
| Points | Points to polygon | Polygons |
| Lines | Close polylines | Polygons |
Process Control Panel
The control panel is associated with the layer and is shown every time the layer is activated in the TOC, as long as the layer is visible and not in edit mode.
The dialog has a semi-modal behavior in order to allow the user to continue working with gvSIG by using the minimize, maximize, resize and hide buttons (use the X, not the Cancel button, to hide the dialog).
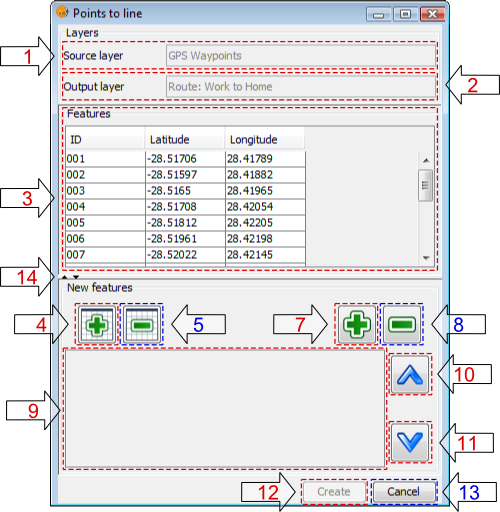
Process control panel
- Name of the source layer: Layer from the TOC that contains the source geometries.
- Name of the output layer: Name of the new derived geometry layer that will appear in the TOC.
- Table of features: Table showing the attributes of all the source layer's features. Source layer geometries selected in the View will also be selected in this table.
- Add all: Adds all the features of the source layer to the table of selected features.
- Remove all: Removes all features from the table of selected features.
- Enable snapping tool: Enables snapping tool on the source layer, without putting it into edit mode (only available in the Castilla y León extension for gvSIG 1.1.2).
- Add selected features: Adds only the selected features to the table.
- Remove selected features: Removes only the selected features from the table.
- Table of selected features: Table showing the attributes of all the features selected from the source layer. It has 2 extra columns:
- Order: Order to be used when generating the new geometry from the selected features in a point source layer, or when closing polylines in the case of a line source layer. The order can be changed with buttons 10 and 11.
- ID: Fixed ID number of the geometry in the vector layer.
- Move up: Moves the selected geometries up one position.
- Move down: Moves the selected geometries down one position.
- Create: Start the process of generating the derived geometries. If it doesn't already exist, a new layer is created, and the new geometries are added to this layer. The process is done in a thread, the progress of which is indicated by a progress bar.
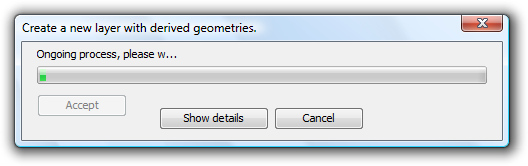
Progress bar
The results of the completed process can be viewed by clicking on the "View Details" button. There are three types of data that are of interest here:
- Number of geometries to create: depends on the geometry selected:
- If they are of type point: one line or polygon is created.
- If they are of type line: one polygon is created for each line.
- Number of geometries that could not be created: the subprocess failed, for example because a polygon couldn't be derived from simple lines that consist of only two points.
- Number of geometries created successfully: the new geometries created.
 This information is recorded in the gvSIG log.
The control panel is hidden during the process but becomes visible again when the progress dialog is closed.
- Cancel: Closes the control panel and de-registers the associated tools, thereby terminating the tool for the specified source layer.
- Expand / Collapse: Changes the position of the splitter, so as to display only the table of features, only the table of selected features and associated management controls, or both halves of the control panel interface.
Control Panel Behaviour
The control panel is linked to the source layer from the time it is created until it is cancelled by clicking the cancel button.
| Action | GUI Element | Description |
|---|---|---|
| Maximize |  |
Resizes the dialog so that it fills all available space. |
| Minimize |  |
Minimizes the control panel to a restore button. |
| Collapse |  |
Control panel is hidden but remains linked to both the source and output layers. Further operations between these layers can be performed once the panel is restored. |
| Resize | The size of the control panel can be increased or reduced by selecting and dragging the edge of the panel. | |
| Expand / Collapse splitter interface |  |
These controls are used to display only the table of source layer features, or only the table of selected features and associated management controls, or both halves of the control panel interface. |
| Cancel |  |
Closes the tool so that is no longer available for operations between the source and output layers. |
When the control panel is hidden it can be restored it by clicking on the source layer in the TOC.
If the View is closed when control panels are visible, the panels will be hidden and then restored when the View is reopened.
 Geometries derived from points do not retain any attribute values but do maintain the columns. Those derived from lines, keep all attributes.
Removing the new layer associated with control panel will result in the tool being ended and a warning being displayed to the user.
Examples
This example will show how to generate a line layer showing the path followed from home to work, and back again. The example uses the following four shape layers:
- Land-use: layer showing parcel boundaries of the town.
- Rivers: layer showing rivers in the town.
- Lakes: layer showing lakes in the town.
- GPS Waypoints: shape layer containing points recorded by a GPS on the drive to and from work. This layer will be used as the source layer in the example.
Once all four layers have been loaded the "Derived Geometries" tool can be selected and the following values entered:
- Source layer:
- Layer: GPS Waypoints
- Output Layer:
- Name: Route: Work to Home
- Path: .../RouteWorkToHome.shp
- Type: Lines
- Options:
- Mode of operation: points to line
When "OK" is clicked the new process control panel appears. If a file with the same name as the new output layer already exists then the user is asked whether to continue or not. If yes, then the file will be overwritten.
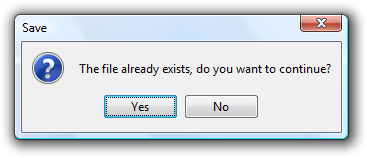
Warning of an existing layer
Minimizing the control panel will reveal the View:
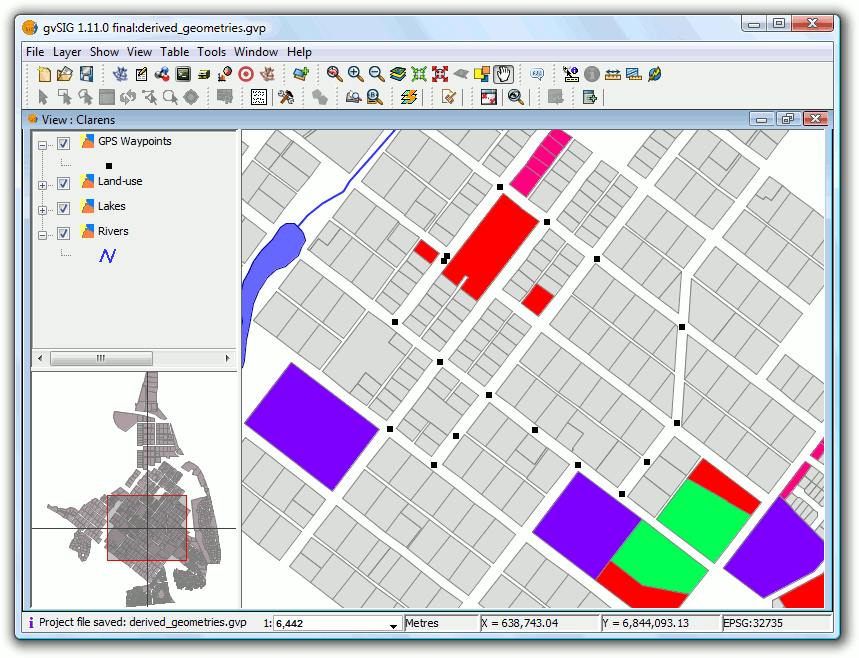
View showing the layers
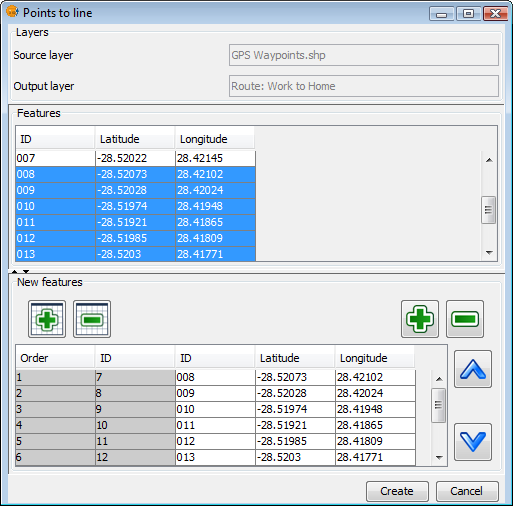
The geometries can be selected from the top table in the control panel.
We select the first seven geometry points (1st route: work to home).
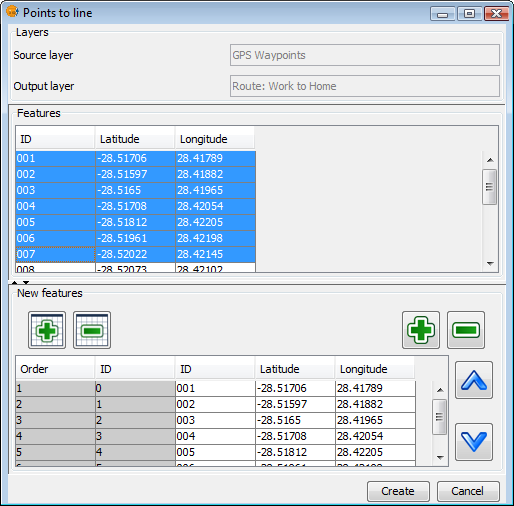
Selected geometries
Click "Create" to generate the first path:

Resulting route generated by the "Points to line" process
Modify the symbology so that the route stands out as a thick line.
To generate the route back, activate the control panel and select the remaining points from the source layer so that the line can be generated:
Selected geometries

Resulting new route
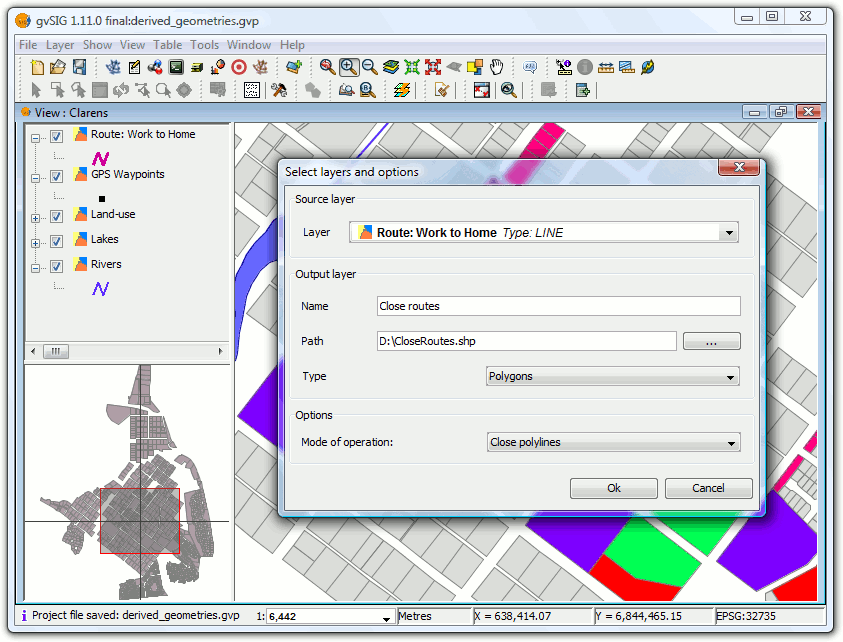
Finally suppose we are interested in the polygon formed by the closure of the routes.
Cancel the tool and then reopen it but this time use the new layer as the source:
- Source layer:
- Layer: Path: GPS Waypoints
- Output Layer:
- Name: Close routes
- Path: .../CloseRoutes.shp
- Type: Polylines
- Options:
- Mode of operation: close polylines
Process "close polylines"
Select all the geometries (the two polylines) and generate the polygons.
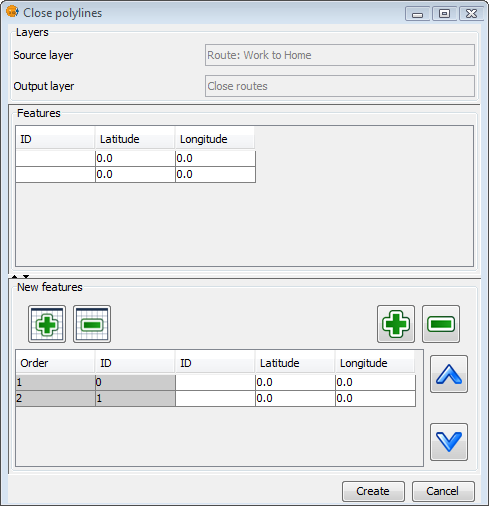
Selected geometries
Since the layer "Route: Work to Home" does not contain data due to the points to line process, we assign a distinguishing identifier to each by editing the layer.
Now apply some changes to the symbolology:
- Layer "Close routes": select a unique values symbology to distinguish the two polygons, and choose fill patterns that allow the lower layers to be seen.
- Layer "GPS Waypoints": Use a symbol of a car for the points and place the layer above the other layers.
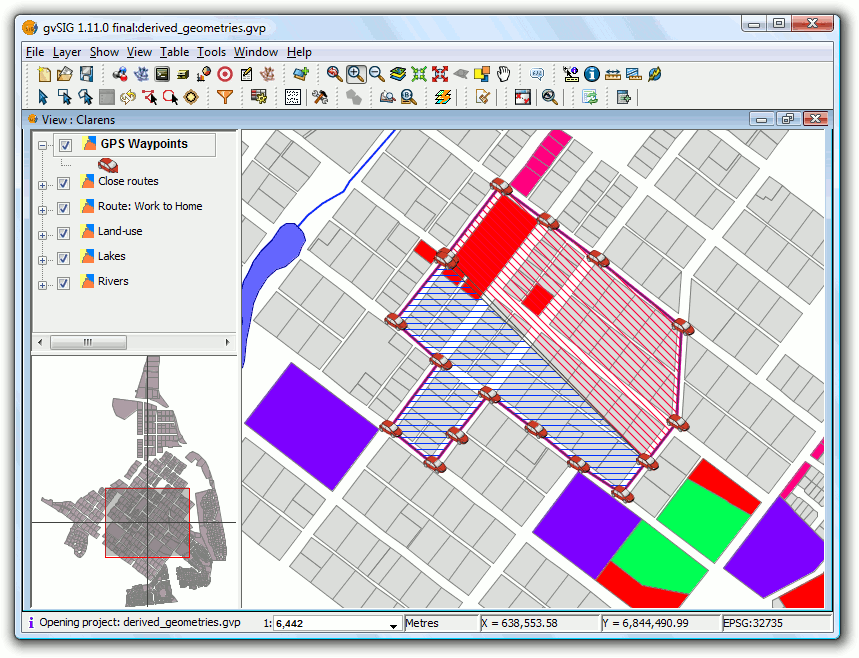
Results of the polygons generated by the "Close polylines" process
Imprimir vista sobre una plantilla
Wizard to print the active View using a template
Adds the ability to print a View using a wizard, which can change basic parameters (title, page size, etc). This option is accessible through the menu View/Quick Print.
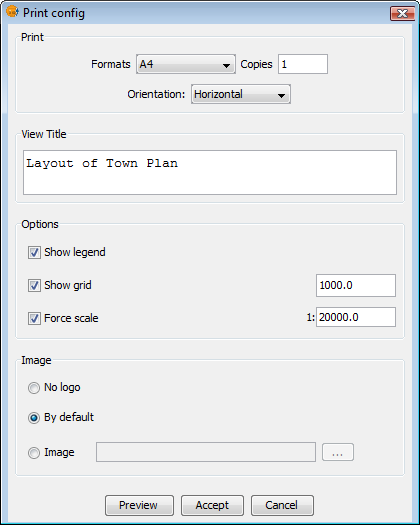
Print Config
You can set:
- The format: A0, A1, A2, A3, A4.
- Number of copies.
- Orientation, horizontal or vertical.
- The title.
- The scale at which to display the View.
- Show a grid and specify its range.
- Show the legend.
- Display a custom or a default logo.
The result looks something like this:
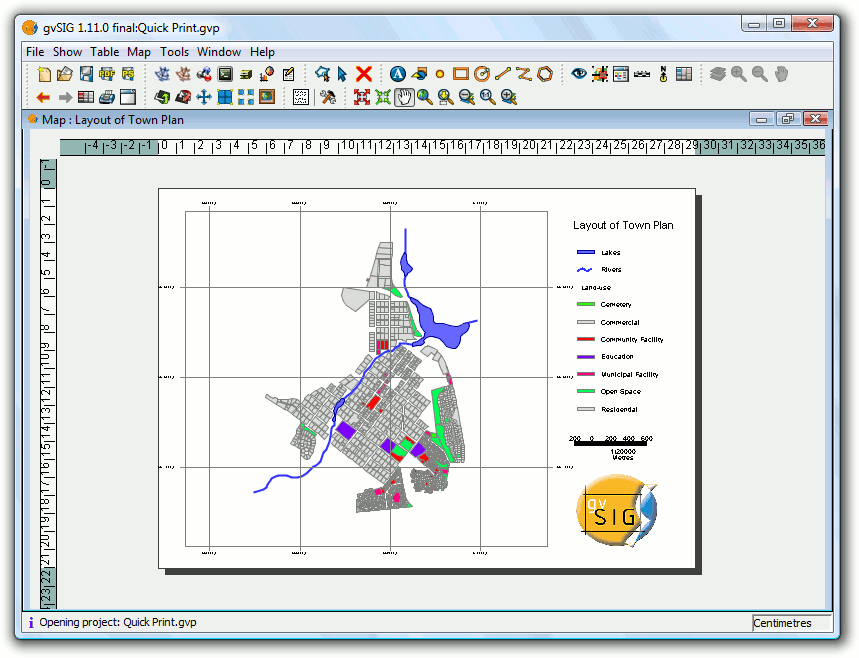
Final result
You can print directly from the wizard, or first preview the result (as shown in the screenshot) and then print from this preview. It is also possible to modify any element in the preview (the width of the map, layers displayed in the legend, etc.) in the same way as amending any Map document in gvSIG.


